|
To know more about the company and its upcoming developments, I attended Sapphire’s 2QFY16 results briefing last Thurs at Peach Gardens. The meeting was hosted by Mr Teh Wing Kwan, Sapphire’s Managing Director and Group CEO, and Mr Ng Hoi-Gee, Kit, Sapphire’s CFO, collectively known as (“Management”). |

Key takeaways from Sapphire's 2QFY16 results briefing (12 Aug 16)
Bright industry prospects
Despite concerns on China’s economy, management believes that spending on infrastructure, especially railway investments continues unabated. In my previous article dated 5 Feb 2016, I cited a 27 Nov 2015 Reuters’ article which reported that China intends to spend RMB2.8 trillion for railway development for 2016 – 2020. However, based on a recent Reuters’ article dated 11 May 2016, China targets to spend around RMB4.7 trillion from 2016 – 2018. Although it is unclear how much of RMB4.7 trillion is for new, or previously budgeted and approved projects, it is still a larger than expected amount, worthy of attention.
Ranken secured RMB2.17b of contracts since Oct 2015
Besides the supportive positive macro picture, on the company level, Sapphire, through its engineering, procurement and construction subsidiary, Ranken Infrastructure Limited, has secured a whopping RMB2.17 billion of contracts since its acquisition by Sapphire in Oct 2015. As at 11 Aug 2016, Sapphire is sitting on a record order book worth RMB2.75 billion.
| Stock price | 26 cents |
| 52-week range | 21.3 – 36.9 cents |
| PE (ttm) | 7.9 |
| Market cap | S$84.8 million |
| Shares outstanding | 325.983 million |
| Dividend yield (ttm) |
-- |
| Year-to-date return | - 18.2% |
| Source: Bloomberg |
Expanded annual production capacity by 25% to RMB 1.25b
Management has expanded its annual production capacity from RMB1.0b in Feb 2016 to around RMB1.25b worth of projects. The speed and the limited capital expenditure to expand its annual production capacity demonstrated Sapphire’s asset light and scalable business with limited capital expenditure. Management intends to ramp up its production capacity further as its order book grows.
Promising results from Ranken
When Sapphire first acquired Ranken, there was considerable scepticism on whether Sapphire can execute well with Ranken. In addition, the market has doubts on Sapphire’s evaluation of acquisition targets as Sapphire has previously made some poor investments by its ex-management. However, based on Table 2 below, Sapphire’s new management (i.e. Mr Teh) seems to have acquired a sustainable business with considerable potential.
Readers should note the following points on Table 1.
| S$ (m) | 2QFY16 | 1QFY16 | 4QFY15 |
| Revenue - Ranken | 46.8 | 44.0 | 61.8 |
| Net profit from Ranken | 3.6 | 1.9 | 2.5 |
Firstly, Ranken only started its contribution in 4QFY15 as it was acquired by Sapphire on 1 Oct 2015. Secondly, Ranken’s revenue in 2QFY16 should have been higher in RMB terms as RMB has depreciated approximately 3% against SGD from 31 Mar 2016 to 30 Jun 2016. Thirdly, Ranken’s revenue is recognised by percentage of completion method, thus it may be lumpy in nature. Notwithstanding this, management said that 1Q is usually the weakest quarter, based on historical trend.
2HFY16F results likely to be better than 1HFY16
2HFY16 is likely to be stronger than 1HFY16 because of the following reasons. Firstly, 1QFY16 is typically the weakest quarter, (pointed out above), which drags down 1HFY16 results. Secondly, management has won RMB2.17 billion of contracts since October 2015, some of which are likely to start contributing in 2HFY16. Thirdly, with the 25% increase in its annual production capacity, it is likely that 2HFY16 should generate more revenue than 1HFY16.
Based on 2QFY16 results announcement, Sapphire expects that it should generate higher profit in FY16F, as compared to FY15. It is noteworthy that the profit generated in FY15 is the highest since FY11.
FY17F results may surpass FY16F
Sapphire announced last month that it is in talks with governments in South Asia. Any contract secured is likely to have positive contribution in FY17F. Furthermore, as Ranken secures more contracts, it is likely that Sapphire will expand its production capacity to cater for the demand. In view of the above, the profit to be generated in FY17F is likely to surpass FY16F, which is by itself likely to be the highest since FY11.
Mancala’s discussions are still on-going but in an advanced stage
Management reiterated that Sapphire is in discussions with various strategic investors such as mining specialist funds and / or engaged in mining – focused businesses.
As I have pointed out last month, Sapphire announced the incorporation of a wholly owned subsidiary, Mancala Holdings. The primary objective for the incorporation of Mancala Holdings is to facilitate future fund raising exercises for the mining services business of the Group, which may eventually lead to a dilution in the Group’s shareholding in Mancala. If such funding materialises, it will be able to show to the investment community that Sapphire is mainly focusing their time, resources and energies on their infrastructure segment. Without the mining segment, Sapphire’s valuation may be able to re-rate closer to its other infrastructure players.
Citing reference from Mining-journal.com, Management pointed out that although Mancala is currently generating little revenue and profit, it is one of the world’s top 50 mining and drilling contractors in 2016.
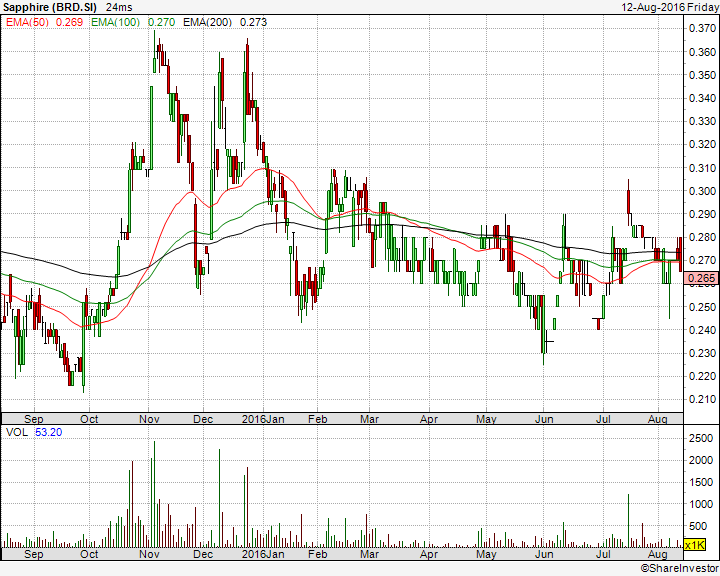
Chart outlook
Sapphire’s has been broadly trading within a range of $0.240 – 0.300 since Jan 2016. A sustained break with volume expansion at $0.240 / 0.300 points to an eventual measured technical target of around $0.180 / 0.360 respectively. However, due to Sapphire’s illiquidity where average 30D and 100D volume amounted to 179K and 132K shares respectively, chart observation may be less accurate. Sapphire closed at $0.265 last Fri. (See Chart 1 below)
Near term supports: $0.260 / 0.250 / 0.240
Near term resistances: $0.270 – 0.275 / 0.300 / 0.310
Chart 1: Range bound between $0.240 – 0.300
 "Valuation: "Valuation:
By annualising its 1HFY16 results, Sapphire is trading at approximately 9x FY16F earnings. However, it is likely to be trading less than 9x FY16F earnings, as 2HFY16F results is likely to be stronger than of 1HFY16. Furthermore, with FY17F likely to be better than FY16F, Sapphire’s valuations are likely to be lower next year." -- Ernest Lim CFA, CA (photo) |
Usual risks apply
Although business execution risks have diminished, it does not mean that there is zero business and execution risk. Also, the usual risks in stock investing, especially in small caps apply. For example, Sapphire is extremely illiquid and it is difficult for investors with significant positions to exit without selling down several levels. Such selling, if it occurs, may result in Sapphire breaching the minimum trading price of $0.200.
Furthermore, as there is no rated analyst coverage at this time, it may take a long time before Mr Market recognises the investment merits in Sapphire.
Conclusion – Sapphire gets cheaper as it delivers on earnings
I have written previously that Sapphire is evolving to be a proxy to infrastructure growth. Since my first write-up on Feb 2016, Sapphire has seen some enquiries (or interest) from the investment community, such as fund managers and analysts.
With the past three consecutive of delivery on earnings, Sapphire’s business seems to be gaining traction. Valuations are likely to become cheaper as it continues to deliver on earnings. Nevertheless, among the possible risks, readers should take note of its illiquidity risk and lack of analyst coverage.
P.S: Readers who wish to know more about Sapphire can refer to their informative website HERE. You can also refer to my write-ups on Sapphire below
Sapphire’s order book hits a record high (15 Jul 2016) (click HERE);
Sapphire’s chart strengthens (5 May 2016) (click HERE);
Sapphire – proxy to infrastructure growth (5 Feb 2016) (click HERE)
Disclaimer
Please refer to the disclaimer here


