Republished from Ernest Lim's blog with permission
|
|
What has changed?
Based on my personal observation, three things have changed which may have contributed to the fall in GSS’ share price.
1. Recent weakness in small- mid-cap oil stocks
Although oil prices are still trading around US$47 / barrel, Singapore small- mid-cap oil stocks have fallen with the suspension of Ezion, (touted to be one of the most resilient small- mid-cap oil stocks by some analysts). For example, Mermaid and AusGroup have slid around 15% and 6% respectively since 8 Aug 2017 (the last day which Ezion traded.)
2. Recent profit taking in technology stocks
Technology stocks such as AEM, Memtech, Venture have slipped 5 – 17 % from their recent highs. Coupled with point 1 above, this may put some selling pressure on GSS, as it has two business segments, viz. precision engineering (“PE”) business and oil business.
3. Chart break
GSS’ bearish chart breakdown from its 4-month trading range $0.152 – 0.181 casts a pallor on its share price. (see Chart 1 below) 100D, 50D and 20D exponential moving averages (“EMAs”) are turning down with death cross formed between 20D and 50D EMA. ADX is 33, amid negatively placed DIs which is indicative of a trend. At the time of writing, GSS has slipped below its 200D EMA at around $0.141. In order to be less bearish, it should regain $0.141 in the next few days.
Notwithstanding the above bearish factors, there are two potential positive factors. Firstly, there seems to be a bullish hammer formation on 18 Aug 2017. Hammer formation is a bullish reversal pattern that follows after a steep decline but it requires confirmation. Confirmation can be either in the form of a long green candle, or a gap up with volume expansion. Thus, we have to assess whether GSS moves up in the next few days. Secondly, RSI has slipped to oversold level of around 23 which is the lowest last seen on 28 Dec 2015.
Near term supports: $0.134 / 0.130 / 0.128
Near term resistances: $0.138 / 0.141 / 0.149
Chart 1: A potential bullish hammer formation
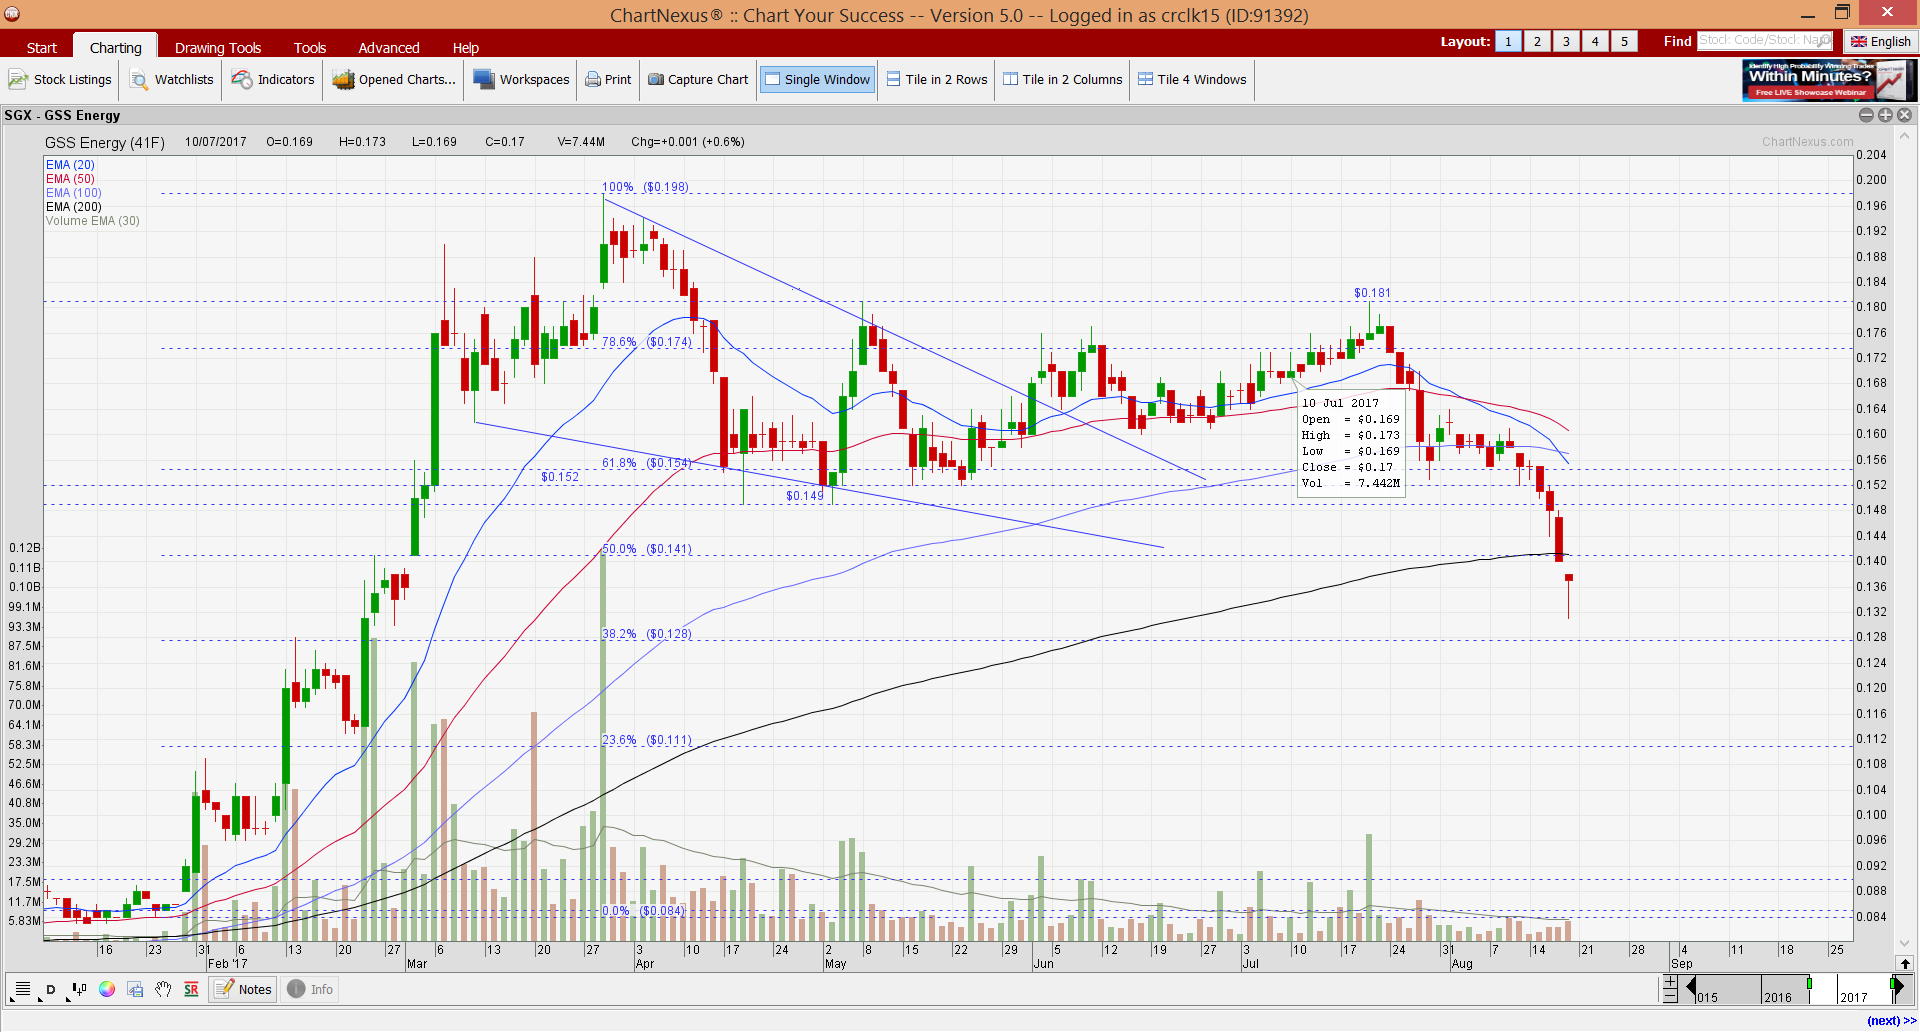
Source: Chartnexus 18 Aug 2017
What has NOT changed?
1. First oil imminent à likely to be in the next few months
GSS, in its latest results released on 14 Aug 2017, stated that preparations to commence production drilling in Trembul Operation Area are well advanced. With reference to an article on Jakarta Post dated 24 Jun 2017 (click HERE), GSS may commence drilling this month and start oil production in Sep.
2. PE business going strong
1HFY17 PE revenue and net profit rose 27% and 57% respectively on a year on year basis to S$44.7m and *S$3.9m respectively. Its PE business continues to win more orders from existing and new customers. GSS has moved to its new China factory this month and expects this new facility to increase its production scale, manufacturing capabilities and enhance cost and production efficiency. Management emphasised that they have stocked up inventory for this transition thus, the transition from the old facility to the new China factory is seamless and does not result in any loss of production capacity.
As with other technology stocks, it is likely that 2HFY17F will be stronger than 1HFY17 due to seasonal factors.
*Do note S$3.9m was the net profit for PE business, before it was set off against the O&G and corporate expenses.
3. PE business trading at discount against peers
If I work on a general assumption that 2HFY17F constitutes about 60% of FY17F PE’s core net profit, GSS is trading at around 7.0x core annualised FY17F PE. (It is noteworthy that 2HFY16 core PE net profit was around S$7.9m vs 1HFY16 core PE net profit of around S$2.5m).
Simplistically speaking, GSS trades at a substantial discount to its sector as the FY17F PE sector average is around 10x. Furthermore, GSS is a net cash company with approximately S$8.2m cash and negligible borrowings.
**The above is based on a back of the envelope calculation. As I am not an equity analyst, the above is purely my guesstimate and may not be accurate.
4. Market continues to price its oil business at zero value
If the above assumption that GSS’ PE business is trading at a substantial discount against its peers is true, then the market is not pricing its up-and-coming oil business with any value. Although I do understand that the investment community may be waiting for GSS to deliver on its oil business, before it ascribes any value to this segment, I think this segment should warrant some value too, as the presence of oil is corroborated by historical data.
According to the same article on Jakarta Post dated 24 Jun 2017, Nederlandsche Koloniale Petroleum Mij (NKPM), a subsidiary of Standard Oil Company of New Jersey, now ExxonMobil, initially explored the Trembul Operation Area and drilled around 307,000 barrels in 1917. The area reportedly has around 40.1m barrels of oil reserve. (Please refer to my earlier articles on GSS and GSS’ announcements on SGX for more details)
Risks
As usual, there are risks involved, especially in small cap stocks with business operations in Indonesia. I wish to emphasise the following risks which have been mostly highlighted in my past write-ups.
1. Execution risk
This is the first time that GSS is operating this KSO contract. Notwithstanding that GSS has employed highly capable personnel in their oil and gas department, there may still be execution risks.
2. Country specific risk
Those who have followed companies operating in Indonesia may be aware that there are things beyond the companies' control, especially on project timeline.
3. First oil is not 100% guaranteed
Although there is historical data to corroborate the presence of oil in the area, it does not mean that GSS may necessarily strike oil. Failure to strike oil, or a lack of news flow in this segment in the next few months, may spark another round of sell-off.
|
Conclusion
|

Readers should refer to GSS website HERE and SGX website for more information.
P.S: I am vested and have informed my clients on Fri (18 Aug) morning.
Disclaimer
Please refer to the disclaimer HERE