Excerpts from UOB KH's report
Analysts: Edison Chen & Nicholas Leow
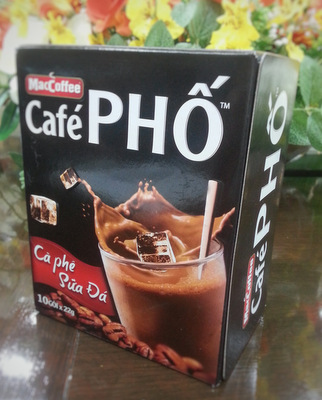 Success in Vietnam, where Food Empire's Cafe Pho has done very well, is inspiring the company to venture into more parts of Asia.Food Empire’s 2Q17 results came in within expectations as net profit to equity holders rose 93.7% on the back of strong growth in sales for most key markets. Success in Vietnam, where Food Empire's Cafe Pho has done very well, is inspiring the company to venture into more parts of Asia.Food Empire’s 2Q17 results came in within expectations as net profit to equity holders rose 93.7% on the back of strong growth in sales for most key markets. As core market currencies stabilise with a possible recovery in oil prices, we expect Food Empire’s pricing power to translate into stable growth for the company.
Maintain BUY with a slightly lower PE-based target price of S$0.87 (previously S$0.90). |
||||
WHAT’S NEW
• Food Empire Holdings (FEH) reported 2Q17 results with net profit to shareholders coming in at US$3.2m vs US$1.8m for 2Q16. The increase in net profit was attributable to an increase in sales across all geographies as 2Q17 sales rose 17.6% yoy to US$62.8m.
Russia accounted for about 42% of sales for 2Q17 with sales growing 12% yoy from US$23.8m in 1Q16 to US$26.6m in 1Q17 due to a stronger Russian Ruble (RUB).
Vietnam sales came in flat with sales growing 4% yoy from US$9.1m in 2Q16 to US$9.5m in 2Q17 in the face of a difference in festive season timing and stiffer competition in Vietnam.
Sales in the other markets continued on a strong growth trajectory as sales grew 61.6% to US$13.7m in 2Q17 due to higher sales contribution from the non-dairy creamer plant in Malaysia and the instant coffee plant in India.
• Margins on the rise. Gross margin trended upward from 34.9% in 2Q16 to 37% in 2Q17 due to higher operating leverage together with a more favourable foreign exchange rate.
|
Focus on expansion into new geographies |
|
|

FINANCIAL HIGHLIGHTS
• CEO’s last purchase price at S$0.65/share. FEH’s CEO, Mr Sudeep Nair’s, last open market repurchase of FEH shares was in May 17 at S$0.65 which is at a 3% discount to current share price levels.
STOCK IMPACT
• We have lowered our 2017-19 net profit estimates slightly by 15-3.9% as we tweak our tax rate assumptions upward and fine-tune our selling and distribution expense and general and administrative expense assumptions.
|
Peers |
Market Cap (US$m) |
PE |
P/B |
Yield |
||
|
|
|
FY16 |
FY17F |
FY16 |
FY17F |
|
|
Key Coffee Inc |
1,039 |
65.4 |
42.9 |
1.4 |
1.4 |
0.8 |
|
Oldtown |
329 |
23.0 |
21.2 |
3.4 |
3.3 |
0.4 |
|
Nestle (Malaysia) |
4,505 |
30.9 |
29.2 |
30.4 |
28.9 |
3.3 |
|
Hey Song Corp |
443 |
11.5 |
n.a. |
0.7 |
n.a. |
n.a. |
|
Atlantic Grupa |
388 |
16.9 |
14.9 |
1.4 |
1.3 |
1.5 |
|
Average |
29.5 |
27.1 |
7.5 |
8.7 |
1.5 |
|
|
Food Empire |
263 |
17.8 |
16.3 |
1.6 |
1.5 |
1.2 |