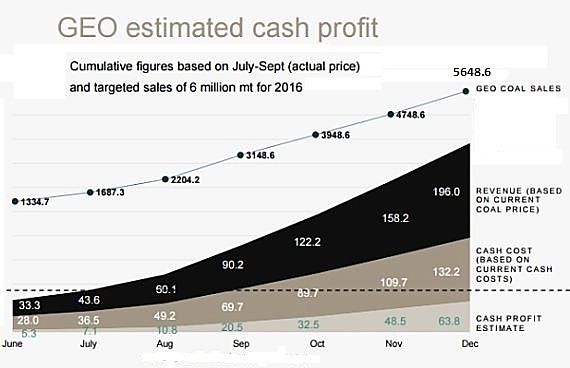
The above chart can be found on page 19 of Geo Energy's presentation to analysts, which was uploaded to the SGX website on 22 Nov.
The title "GEO estimated cash profit" should capture the attention of any investor thumbing through the slides, but the chart needs some digging into.
The curves sloping sharply up to the right represent the cumulative figures for four metrics: Geo's sale of coal in tonnes, its revenue, cash cost and cash profit.
Key elements:
 1. Geo has a target production volume of about 6 million tonnes of coal for 2016. (This is represented by the figure of 5,648.6 in the chart).
2. Working backwards, the assumed average selling price of coal are US$40, US$45 and (conservatively) US$42 per tonne for the months of Oct, Nov and Dec.
Then, Geo would achieve revenue of US$196 million for the full year.
3. The assumed cash cost is US$25 per tonne.
4. Finally, Geo's cash profit is derived from revenue minus cash cost. For the year, the cash profit is expected to be US$63.8 million.
5. And the net profit? It's not given in the chart but from Geo's financial statements, one can estimate the full-year operating expenses (US$5.2 m for 9M2016), interest cost (US$4.6m for 9M2016), and tax (23% for 9M2016).
With these factored in, the net profit comes out at more than US$30 million, which is more than S$44 million.
Set that against the market cap of S$273 million (based on the recent share price of 22 Singapore cents), and Geo Energy's PE ratio is about 6.2X.
And compare that with the US$16.6 million net loss of FY2015.
For 2017, Geo has said it is targeting 10 million tonnes of production. This would lead to a pretty number for its profitability. Asuming US$40 as the selling price and US$25 as the cash cost per tonne, the cash profit would be 10 million x US$15 = US$150 million. |
||||


