Hi-P has tumbled 42% since 2015 high. What gives?
Hi-P has tumbled 42% since the high of $0.790 on 29 Jan 2015 to close $0.460 today. This underperformance is even more appalling if we compare it against the 7.1% drop in FTSE ST All Share Index over the same period. What has happened to Hi-P and whether this stock will continue to languish in the doldrums?
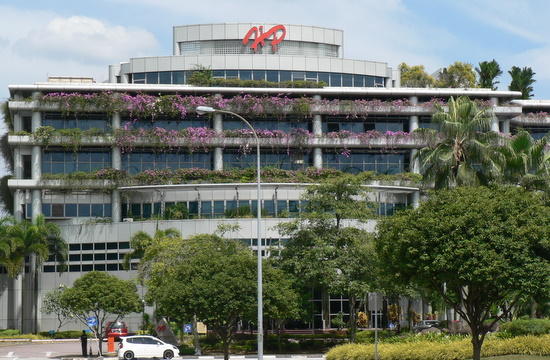 Hi-P's headquarters in Jurong. NextInsight file photo.
4QFY14 and 1QFY15 results have disappointed the market
Hi-P’s results in the previous two quarters, namely 4QFY14 and 1QFY15 have disappointed the market. After the release of 4QFY14 results, both DMG and UOB Kayhian have reduced their target prices from $0.870 and $0.850 to $0.660 and $0.730 respectively.
After its 1QFY15 results which reported a US$13.8m loss and disappointing outcome from Xiaomi project, DMG shaved the target price lower to S$0.430. UOB maintained the target around $0.730.
2QFY15F and more importantly 2HFY15F is key
Hi-P’s upcoming 2QFY15F result is expected to be released on 6 Aug 2015 before market opens. To recap, in its 1QFY15 results, Hi-P provided the following guidance “Barring any other unforeseen circumstances, the Group wishes to guide its performance as follows:
- The Group expects higher revenue in 2Q2015 as compared to 2Q2014. The Group expects to record a loss in 2Q2015.
- The Group expects higher revenue in 2H2015 as compared to 1H2015. The Group expects to be profitable in 2H2015.
- The Group expects higher revenue and profit in FY2015 as compared to FY2014."
Given the above guidance, 2QFY15F is likely to report another loss. Before we write this off, I personally think 2QFY15F may be key to the following:
* whether 2QFY15F net loss (excluding once off items) narrows vis-à-vis that of 1QFY15F;
* Whether Hi-P maintains the same guidance. If Hi-P maintains the same guidance, its 2HFY15F may be pretty exciting. This is because FY14 reported a net profit of S$10.5m. 1QFY15 reported a net loss of S$13.8m and 2QFY15F is expected to report a net loss, hence 2HFY15F has to be strong such that FY15F net profit exceeds that of FY14F;
* Even if Hi-P maintains the same guidance, I will look for clues in the financials to corroborate their optimistic 2HFY15F projections.
Share buybacks
Since 14 May 2015 to 4 Jun 2015, Hi-P has bought back a total of 1,115,000 shares between $0.535 – 0.575. As Hi-P current share price is lower than their share buyback price, there may be a likelihood that company may resume share buybacks after its 2QFY15F results.
Gearing is likely to increase with increased capex in 2015
According to the analyst reports, Hi-P plans to increase its metal stamping facility and is likely to incur higher capex than 2014. (2014 capex amounted to S$113.9m). Hi-P recently also announced that it has obtained increased credit facilities from DBS from US$80m to US$130m and a credit facility from UOB of S$25m. Thus, gearing may increase from 10.7% in 1QFY15 in the subsequent quarters.
Valuations
Hi-P’s net asset value (“NAV”) per share based on its 1QFY15 results is $0.747. At the price of $0.460, Hi-P trades at 0.62x price to book (“PB”). However, it is noteworthy that there may be a slight reduction in the NAV / share with the 2QFY15F expected net loss.
Since 5 Aug 2011 to 31 Jul 2015, the weekly PB ranges from 0.66 to 1.57 with an average PB of 0.98. As of 4 Aug 2015, Hi-P trades at 0.62x PB which is lower than the valuations since Aug 2011. A 0.98x PB valuation will give Hi-P a share price of $0.730.
Chart analysis
Hi-P has tumbled 42% since the high of $0.790 on 29 Jan 2015 to close $0.460 today. Hi-P’s RSI closed at 14.3 today. Since its IPO in 2003, RSI only closed lower than 14.3 in approximately four occasions. At this level, it is extremely oversold.
Near term supports: $0.450 / 0.425
Near term resistances: $0.495 / $0.510 – 0.515
Conclusion
Hi-P’s upcoming 2QFY15F results and its subsequent analyst briefing may hold clues to whether it may be a potential turn around play in 2HFY15F. (It is noteworthy that Hi-P’s 2nd half is typically stronger than its 1st half. This is in line with its industry too.) Meanwhile, its extremely oversold chart should limit any sharp downside potential, barring a nasty shock from its 2QFY15F results.
 This article was recently published on Ernest Lim's (left) blog, and is republished with permission. Please refer to the disclaimer here http://ernest15percent.com/index.php/disclaimer/