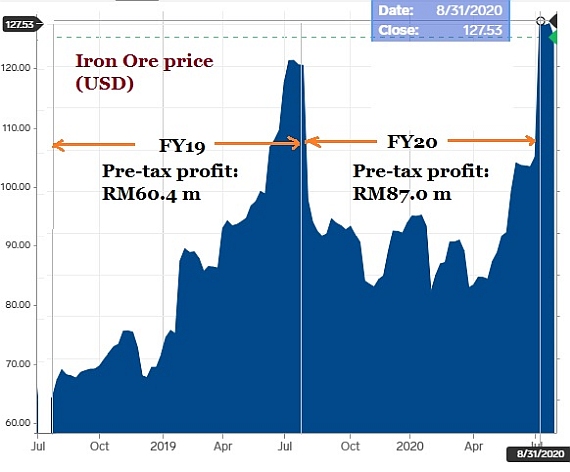
| Southern Alliance Mining (SAM), which listed on the Singapore Exchange in June 2020, produces iron ore, a commodity whose price has stayed elevated for around a year now. Malaysia-based SAM has just reported a 44% jump in pre-tax profit to RM87 million for FY20 ended July. It's a result that would have been better if not for the suspension of operations during the Movement Control Order imposed by the Malaysian Government due to the COVID-19 pandemic. This chart shows how iron ore prices have risen in SAM's past 2 financial years and its corresponding pre-tax profits. |
 SAM's average selling price of crushed iron ore in FY20: RM410.29 per MT (FY19: RM332.61 per MT).
ASP of iron ore concentrate: RM357.00 (FY19: RM348.40 per DMT).
Basic chart: Business Insider
As captioned above, SAM sells not only iron ore concentrate (to steel mills in Malaysia) but also a smaller quantity of crushed iron ore (for use in the oil & gas industry).
The latter fetches higher prices because it does not need to go through processing to become iron ore concentrate.
Crushed iron ore which has low impurities is used as coating for sub-sea pipes.
"As the specifications required for the product are unique and it is not widely available as compared to iron ore concentrate, it commands a premium over iron ore concentrate," explained CFO Lim Wei Hung.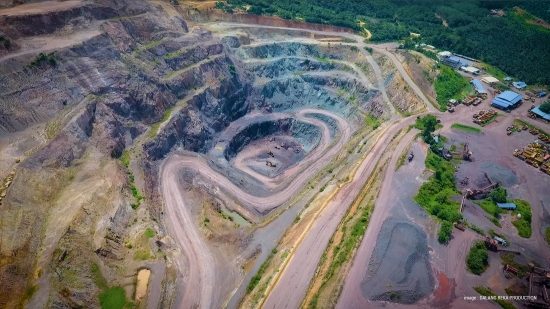 Open pit at Chaah Mine in Johor operated by Southern Alliance Mining since 2008. Photo: Company
Group gross profit margin in FY20 rose by 9.37 percentage points, from 32.76% to 42.13%.
While the FY20 pre-tax profit rose, the net profit after tax fell 30% from RM88.2 million to RM62.1 million.
The simple explanation: There was a tax credit of RM27.9 million for FY19 but a tax expense of RM24.9 million for FY20.
(The long explanation in SAM's financial statement: The tax credit in FY19 was in recognition of deferred tax asset of RM27.9 million arising from unutilised tax losses the financial years before. The income tax expense for FY20 comprised current year tax expense of RM0.4 million and the utilisation of prior year tax losses recognised as deferred tax asset of approximately RM24.5 million.)
We asked: What will the FY21 tax recognition be? CFO Lim replied:
|
In FY2019, the Group was recognised a “tax credit or deferred tax asset”, i.e. a credit item to tax expense which was an unique position. This arose due the accounting standard requirement to recognise a “deferred tax assets’” or in layman term, previous year tax losses credit as an asset in order to smoothen future tax expense.
Moving forward, should the Group continue to report profit in FY2021, it shall report and pay a (Malaysian corporate) tax of 24% of its taxable profit. |
Let's return to the iron ore market and here's SAM's commentary on the outlook:
| In September, major banks forecasted that although iron ore price could pull back moderately from the current over-five-year high, it will “likely be rangebound between US$100/t-US$120/t for the rest of 2020”. In addition, leading indicators (along with buoyant iron ore prices) such as low port stocks and positive steel margins, remain positive for iron-ore exposure, and Chinese demand for steel remains a key factor to determine the iron ore price. As long as China continue to shore up its economy for the next 12 months, there is a possibility that the iron ore price may maintain in a range that would help the earnings of the Group for the next financial year. |
|
Stock price |
30 c |
|
Post-IPO range |
26 – 30 c |
|
Market cap |
S$147 m |
|
PE (based on FY20) |
7 |
|
Dividend yield |
2% |
|
Shares outstanding |
489 m |
|
|
|
If the ASP range of US$100/t-US$120/t stays, the profitability of SAM is set to jump this year.
(That's RM417/t - RM500.4/t)
SAM's breakeven point ranges from US$30 to US$50 per tonne, said CFO Lim Wei Hung in last week's FY20 results briefing.
SAM proposed a final dividend of 0.6 Singapore cents per share, representing a 14.7% pay-out of its profit, which is higher than the 10% that it guided in its IPO prospectus.
| In the FY20 results briefing, CFO Lim presented figures on how SAM's production volume has matched its resource estimates. "This is something that's very important for investors and analysts to pay attention to," he said. Estimates of resources and reserves in a mine are made and reported after exploration work, and the question is how reliable are such figures. Are they over-estimates, a not uncommon ocurrence in the mining industry? From 2014 to 2019, based on SAM's resource estimate of 3.37 million tonnes, SAM actually delivered ore of 3.42 million tonnes (see table). "By industry practice, it is an excellent reconciliation," said CFO Lim.
For FY20, SAM produed 1.2 million tonnes of ore, which was a lot more than the estimated 830,000 tonnes in its resource model. After investigations to improve its modelling, SAM zeroed in what was considered "mineralised waste" -- ie waste rocks that contained ore -- amounted to 120,000 tonnes. When included as ore, the production volume was 126% of the tonnes predicted from the resource model. This implies that the geological interpretation underpinning the resource model was conservative -- it predicted less mineralisation within the material mined in FY20. From this experience, SAM's geologists and mining engineers can finetune their resource modeling, which can only add credibility to future resources and reserves estimates that are reported.
|
||||||||||||||||||||||||||||||||||||||||||||||||||||||||||||||
For more info, see SAM's FY20 results statement.