Excerpts from SGX article
• In its January report, the World Gold Council said it expects increased market uncertainty, expansion of protectionist policies, and the Fed's more neutral monetary policy stance to make gold increasingly attractive to investors as an effective portfolio diversifier and hedge against systemic risk.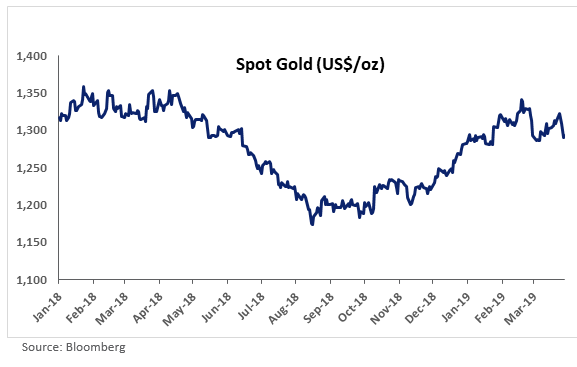 • In late February, spot gold surged past the US$1,346/oz level to a 10M high, buoyed by uncertainty over the outlook for global economic growth and trade. Bullion prices have since pulled back, ending the March quarter at US$1,292.38/oz, up 0.8% since the start of the year. |
SGX offers investors opportunities to participate in the gold sector through three mining stocks – CNMC Goldmine, Wilton Resources and Anchor Resources – and the SPDR Gold Shares ETF.
For 1Q 2019, the ETF generated a 4.6% and 4.8% YoY increase in volume and turnover respectively.
Volume and turnover for the ETF also nearly doubled in March from the previous month.
SGX’s Gold Mining Trio
SGX’s three gold mining plays – CNMC Goldmine, Wilton Resources and Anchor Resources – are in different stages of the gold exploration, development and production cycle.
The trio, with a combined market capitalisation of about S$180 million, have averaged a total return of -12.7% in the first three months of 2019. This is an improvement over average total returns of -31.9% over the last 12 months.
While gold stocks have a high correlation to physical gold, they are typically considered leveraged plays on the metal.
In addition to bullion prices, there are also many other factors – such as corporate activity, currency, gold discovery, earnings power, operating efficiencies – that impact the price of gold stocks.
Mining companies may also often take up to 10 years or longer to develop their mining projects and bring them to production.
While there are no upstream gold mining activities in Singapore, the city-state is home to downstream international gold refineries and bullion product manufacturing plants, with significant storage capacity through Singapore Freeport.
The table below details the three gold mining plays sorted by market capitalisation.
|
Name |
Mkt Cap (S$M) |
Total Return YTD (%) |
Total Return 1Y (%) |
Total Return 3Y (%) |
P/E (x) |
P/B (x) |
Div Yld (%) |
|
CNMC Goldmine |
90 |
2.3 |
-13.1 |
11.1 |
40.0 |
1.6 |
0.9 |
|
Wilton Resources |
73 |
-14.3 |
-45.5 |
-55.9 |
NA |
3.9 |
NA |
|
Anchor Resources |
19 |
-26.1 |
-37.0 |
-86.8 |
NA |
4.7 |
NA |
|
Source: Bloomberg & StockFacts (data as of 29 March 2019) |
|||||||
 3-minute video of the gold mine's facilities and operations of Anchor Resources >


