Republished from ThumbTackInvestor with permission
|
I added 100,000 shares on the 26/07/2017 at $0.24. Right now, I have a total of 600,000 shares at an average cost of $0.182. Geo Energy is such a headache. Coal prices have continued increasing unabated as I expected them to, going into the summer months. Yet Geo Energy’s share price has dipped. What gives? There are a few factors to consider: The average selling price of the coal it mines & the total volume of coal mined. I think it’s safe to say that the ASP would be well protected in Q2. Geo is likely to report an ASP that’s not too far away from what’s achieved in Q1 (prob a tad lower), which is really not too bad at all.
For the record, the ASPs achieved looks like this (see table): I don’t think Geo’s ASP in Q2 would be too far from US$37 or so. |
 Geo’s ASP is pegged to Indonesia’s HBA index. After a sizable drop in June, the index has since recovered.
At the end client side, Chinese import coal prices at QinHuangDao has continued rising going into summer and is now again out of the range guided by China’s NDRC. They’re having real difficulty keeping prices in check.
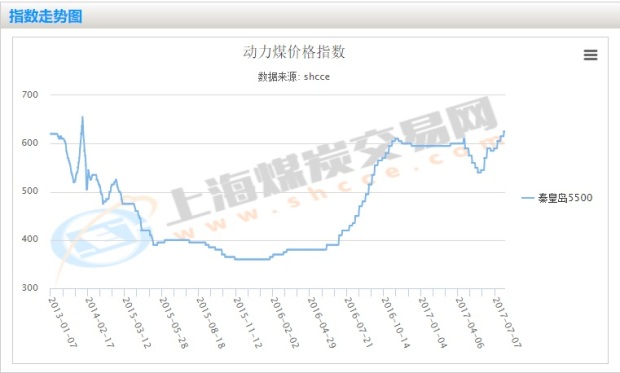
So it’s safe to say that prices are still very much well supported.
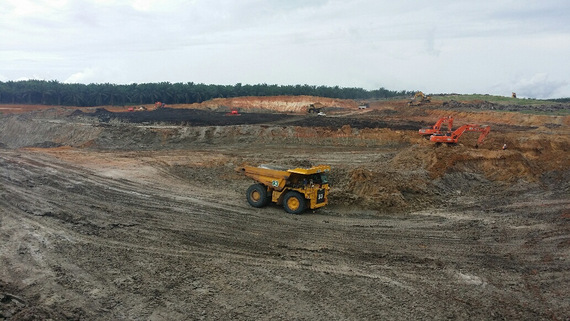
To investigate further, I looked into the major clients/end users of Geo’s coal.

In 2016, Geo delivered 5,510,723 tonnes and, in 1Q2017, delivered 2,212,893 tonnes, giving total tonnage of 7,723,616 tonnes.
Of which, China Resources Power is the end user for 2,189,149 tonnes or 28% of total volumes mined during this period.
Fortunately, China Resources Power is a public company listed on HKEx, so it is not difficult to dig into the happenings of the company.
Aside from power generation, the company owns several coal mines themselves too.

I’ve highlighted the thermal plants part under power generation, since that’s what we’re interested in. In Q1 of 2017, thermal power generation increased by 2.0% y-o-y.
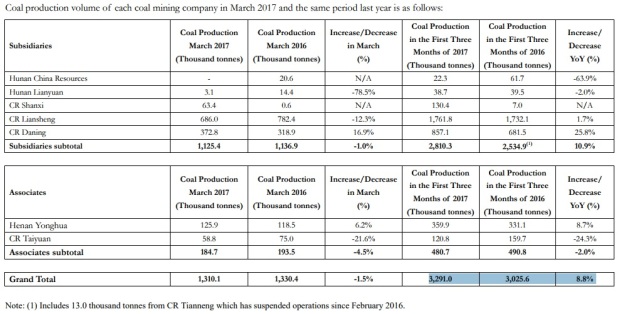
During the same quarter, coal production increased by 8.8% y-o-y.
Now, let’s compare it to the 1H results to have a sense of how things have progressed.

In 1H, thermal power generation has increased much more rapidly, by 8.1% y-o-y
It’s more accurate to compare figures for each quarter against the preceding year’s, instead of comparing q-o-q due to seasonal demand. For example, Q2 and Q3’s thermal power generation is always going to be higher than Q1 due to the summer months.

Yet, the total coal production for 1H came in at -3.1%.
So let me give my interpretation of the results:
Thermal Power Generation: Q1 2017 increased from Q1 2016 by 2%, yet at the 1H mark, this same metric has increased by 8.1% y-o-y.
This can only mean that thermal power generation has increased in both 1Q2017 and 2Q2017 vs their corresponding periods last year, but has increased at a faster rate in 2Q2017 vs 1Q2017. So the nett effect is that we know that China Resources Power burnt coal at a faster rate in 2Q2017 vs 1Q2017, and also in 2Q2017 vs 2Q2016.
Coal Production: Q1 2017 coal production increased by 8.8% y-o-y, yet at the 1H mark, this same metric has actually decreased by 3.1%. This can only mean that coal production in Q2 of 2017 has dropped so much vs the corresponding period in 2016, so as to drag down the change from a +8.8% as of Q1, to a -3.1% change as of 1H.
So the overall conclusion is:
Comparing Q2 vs Q1, rate of thermal power generation increased, whilst the coal mined rate decreased.
Logically, this means that they’d have to import more coal in Q2 to make up for the shortfall.
Now, that’s a good conclusion to have for Geo Energy.
Perhaps the best indication of well supported coal prices comes from this profit warning by China Resources Power:

This is not foolproof though. China’s NDRC has been encouraging utilities to lock in long term contracts with local miners. So we don’t know for sure whether the amount of coal taken from Geo Energy has increased or decreased or stayed the same.
In addition, from reports at the QinHuangDao ports, it seems that utilities and coal importers are locked in a standoff over prices. Coal importers are unwilling to lower prices, but utilities are unwilling to buy either. So we have a stasis whereby prices look high as evidenced by the coal indices, but the actual volumes transacted are reportedly very low.
And therein lies the uncertainty. The uncertainty for Geo Energy lies in the amount of coal mined. Prices are going to be ok, but can they deliver?
Add on to these worries is rainy weather that may again curtail mining activities.
Volume though, is not my biggest concern, although judging from comments on IN and other forums, that’s what most people are looking at. As recently as a couple of weeks ago, management reaffirmed their commitment to a 10mil tonnage target for this year. Q2 has already concluded, so they’d know the figures. Surely they’d revise if they think it can’t be met.
|
My biggest worry is actually this: Regulation No. 34 of 2009 and the relevant update: Regulation No. 23 of 2010 For the serious investor, you can read the hardcore version here: Basically, Indonesia’s government wants to limit both the total coal mined, as well as the volume of coal exported. The rationale is to control the amounts of coal, such that there’s adequate supply for domestic use as part of their nationwide electrification plan starting in 2019. http://www.globalindonesianvoices.com/30567/government-prepares-new-regulation-to-limit-coal-export/ Any regulation to limit the annual total volumes of coal mined, or to increase the amount miners would have to set aside for domestic consumption, would be bad news for Geo Energy. As described in their own latest investors update:
So there. I’m cognizant of the positives for the company and the potential road bumps ahead. By doing a simple extrapolation of Q1 results, the projected PE ratio based on the current share price is a ridiculous 3.5 times. At these levels, I think there’s sufficient MOS for me to increase my position. |
