Henry Tiong says he is an average Singaporean in his early 30s, has a full-time job, is happily married and caught within the sandwich class. He lives in an executive condominium with a "mountain-like mortgage". "My goal is to achieve financial freedom as early as I can. My target is 45 years old. I don't mind working but I hope to provide my wife an option not to work." The following article was recently published on his site Valuestocks.org and is republished with permission.
Following up on PEC which we last blogged about in July 2013. (PEC Ltd is a specialist engineering group servicing the oil and gas, petrochemical, oil and chemical terminal, and pharmaceutical industries. Its two core business activities are project works -currently carried out in Singapore, Malaysia, Thailand, Indonesia, Vietnam, the PRC and the Middle East - and maintenance services - currently carried out in Singapore and the PRC).
Following up on PEC which we last blogged about in July 2013. (PEC Ltd is a specialist engineering group servicing the oil and gas, petrochemical, oil and chemical terminal, and pharmaceutical industries. Its two core business activities are project works -currently carried out in Singapore, Malaysia, Thailand, Indonesia, Vietnam, the PRC and the Middle East - and maintenance services - currently carried out in Singapore and the PRC).
|
Q2 2014 summary: Q2 & half year revenues continued to weaken in double-digit percentages relative to previous corresponding periods Operating expenses continued to creep up Half yearly profit attributable to shareholders down 30% Bright spot - Balance sheet remains solid A quick recap of the initial investment thesis. PEC was trading near its 52 week lows (which has now gone lower). Dividend yield was around 4.4%. PEC's huge cash hoard made up a significant portion of market capitalisation and its gearing was extremely comfortable. This was topped off by a price that represented a discount to book value. In summary, PEC was an investment that cried out "cheap assets, cheap dividends, low exposure to interest rate hikes." |
How is PEC now?
Stock Fundamentals
|
||||||||||||||||||||
PEC's half year EPS is 1.6 cents. A simple annualisation gives us 3.2 cents per share.
At the last close price of 54 cents, PEC is trading at 17 times earnings or generating 6% earnings yield.
Ideally, we would prefer to label a stock cheap when it is trading at 15 times earnings or less. But again, we aim not to be totally mechanical in the approach.
|
NAV per share is 82.1 cents. In other words, PEC is trading at a 34% discount from its book value.
Of course, the argument is that PEC does not deserve to be trading at its NAV price of 82 cents.
Reason is simple. PEC's return on assets is low.
Give you an example. If PEC trades at 82 cents per share, while it reflects NAV value, it would be trading at 26 times earnings.
26 times earnings is pretty expensive for a capital-intensive business performing at a Return on Assets (ROA) of 4% (3.2 / 82.1).
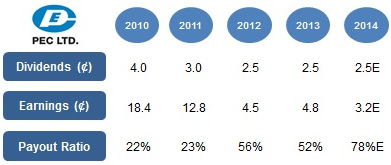 Source: valuestocks.sg(iii) Decent & Sustainable Dividends
For the past two years running, PEC has given out 2.5 cents dividends each year.
That works out to be a dividend yield of 4.6% based on last close of 54 cents.
A prudent question to ask: Can PEC continue to give out 2.5 cents dividends?
Based on our earlier earnings estimates of 3.2 cents, a 2.5 cents dividends would mean a dividend payout ratio of 78%. While not at REIT-ish levels, it can be considered high.
More importantly, we should probably assess this payout ratio based on historical records.
PEC has given out dividends since 2010. As we can see from the table, PEC's dividend payout ratio has not crossed 56% in the last five years.
While there is no fixed dividend policy declared by management, should PEC intend to sustain its dividend payout ratio at 56% as a cap, we should therefore expect a dividend of 1.8 cents (56% of 3.2 estimated EPS).
This dividend translates to a yield of 3.3% based on last close of 54 cents. The much discussed OCBC 3.03% is not too far away. Not good for a presumably higher risk instrument.
So depending on the dividend payout ratio, it would be prudent for us to assume a range of 3.3% - 4.6% in terms of dividend yield.
(iv) Very Conservatively Financed
As at 31 Dec 2013, PEC's total interest-bearing liabilities were S$8.1M, or a D/E ratio of 4%, which is very low for a capital intensive business.
Also, the cash levels were almost S$81M, 10 times debt levels. Of course, the cash levels also help to solidify our belief that dividends in part (iii) can be sustained.
A 2.5 cents dividend equates to S$6.4M, so it is within very comfortable range for PEC given its large cash holdings.
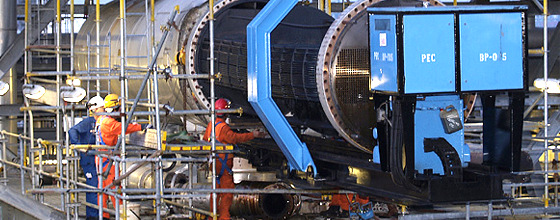 Having done the initial project work, the likelihood of PEC being able to secure the subsequent maintenance contract is decent. Photo: Company
Agree with PEC's Strategy
(i) Recurring revenue streams from Maintenance
The beauty of PEC's business model is that project works and maintenance projects are highly complementary.
And having done the initial project work, the likelihood of PEC being able to secure the subsequent maintenance contract is decent.
Maintenance work is long-term in nature and brings steady, recurring income to the table, but may be smaller in revenue size (annualised basis) compared to project work.
PEC has highlighted that they see increased activity in maintenance business as clients focus on enhancing existing facilities.
It makes sense to look out for success in growing this revenue pie going forward.
(ii) Enhancing and expanding capabilities via strategic acquisition
PEC acquired CAR-BER in January 2014.
This gives PEC access to licensed tools that enable them to provide testing and isolation services to the on-shore and off-shore oil and gas industry.
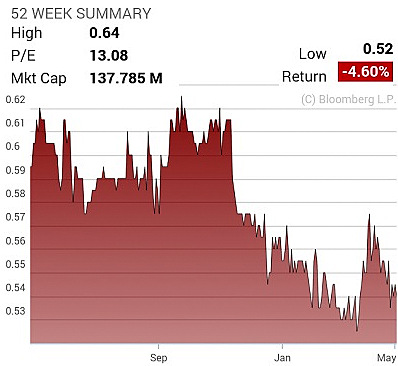 Chart: Bloomberg(iii) Orderbook
As at 31 Dec 2013, PEC's orderbook was S$179M (excluding maintenance contracts).
The size of the orderbook gives us a sense of how much profit is coming on board. In fact, we can make a broad estimation.
Assuming net margins remain at FY2013 levels of 2.4% (per annual report), we can estimate a positive bottom line impact of S$4.3M from the orderbook, or EPS impact of 2 cents per share.
But of course, the 2 cents recognition is not immediate given that the length of project works can vary.
For example, back in October 2013, PEC announced contract wins for a fabricated steel structures for a global client's onshore projects. The contract is for 5 years, till July 2018.
Conclusion
PEC's earning power appears to have weakened.
While we await to see the results of management tackling issues such as foreign worker levies and productivity challenges, we refuse to press the panic button.
After all, PEC is still a profitable business. Going forward, barring unforeseen circumstances, NAV should continue to expand.
While NAV is expected to increase (albeit not exponentially), the share price should make its way up correspondingly.
But we know better that Mr Market can be quite illogical.
Given that market is more reactive to earnings, it is our expectation that PEC's share price will not provide us with much excitement in the short term.
Based on our earlier earnings estimates of 3.2 cents, a 2.5 cents dividends would mean a dividend payout ratio of 78%. While not at REIT-ish levels, it can be considered high.
More importantly, we should probably assess this payout ratio based on historical records.
PEC has given out dividends since 2010. As we can see from the table, PEC's dividend payout ratio has not crossed 56% in the last five years.
While there is no fixed dividend policy declared by management, should PEC intend to sustain its dividend payout ratio at 56% as a cap, we should therefore expect a dividend of 1.8 cents (56% of 3.2 estimated EPS).
This dividend translates to a yield of 3.3% based on last close of 54 cents. The much discussed OCBC 3.03% is not too far away. Not good for a presumably higher risk instrument.
So depending on the dividend payout ratio, it would be prudent for us to assume a range of 3.3% - 4.6% in terms of dividend yield.
(iv) Very Conservatively Financed
As at 31 Dec 2013, PEC's total interest-bearing liabilities were S$8.1M, or a D/E ratio of 4%, which is very low for a capital intensive business.
Also, the cash levels were almost S$81M, 10 times debt levels. Of course, the cash levels also help to solidify our belief that dividends in part (iii) can be sustained.
A 2.5 cents dividend equates to S$6.4M, so it is within very comfortable range for PEC given its large cash holdings.
Having done the initial project work, the likelihood of PEC being able to secure the subsequent maintenance contract is decent. Photo: CompanyAgree with PEC's Strategy
(i) Recurring revenue streams from Maintenance
The beauty of PEC's business model is that project works and maintenance projects are highly complementary.
And having done the initial project work, the likelihood of PEC being able to secure the subsequent maintenance contract is decent.
Maintenance work is long-term in nature and brings steady, recurring income to the table, but may be smaller in revenue size (annualised basis) compared to project work.
PEC has highlighted that they see increased activity in maintenance business as clients focus on enhancing existing facilities.
It makes sense to look out for success in growing this revenue pie going forward.
(ii) Enhancing and expanding capabilities via strategic acquisition
PEC acquired CAR-BER in January 2014.
This gives PEC access to licensed tools that enable them to provide testing and isolation services to the on-shore and off-shore oil and gas industry.
Chart: Bloomberg(iii) OrderbookAs at 31 Dec 2013, PEC's orderbook was S$179M (excluding maintenance contracts).
The size of the orderbook gives us a sense of how much profit is coming on board. In fact, we can make a broad estimation.
Assuming net margins remain at FY2013 levels of 2.4% (per annual report), we can estimate a positive bottom line impact of S$4.3M from the orderbook, or EPS impact of 2 cents per share.
But of course, the 2 cents recognition is not immediate given that the length of project works can vary.
For example, back in October 2013, PEC announced contract wins for a fabricated steel structures for a global client's onshore projects. The contract is for 5 years, till July 2018.
Conclusion
PEC's earning power appears to have weakened.
While we await to see the results of management tackling issues such as foreign worker levies and productivity challenges, we refuse to press the panic button.
After all, PEC is still a profitable business. Going forward, barring unforeseen circumstances, NAV should continue to expand.
While NAV is expected to increase (albeit not exponentially), the share price should make its way up correspondingly.
But we know better that Mr Market can be quite illogical.
Given that market is more reactive to earnings, it is our expectation that PEC's share price will not provide us with much excitement in the short term.
Disclosure: I am vested in PEC.
Recent story: Henry Tiong: "Is VALUETRONICS still good value after price run-up?"
Recent story: Henry Tiong: "Is VALUETRONICS still good value after price run-up?"
Switch counter maybe better?