|
Throughout the year, U.S. government agencies and other organisations release data intended to give investors a sense of how the economy is faring. Many investors sift through these statistics – which measure things such as gross domestic product (GDP) growth, unemployment and inflation – to get a sense of the economy’s health and forecast possible investment trends. The trouble is that while there is a lot of data out there, not all of it is useful for gauging stock market behavior. While sudden changes in economic conditions can lead to a short-term reaction in the stock market, the effect of any single economic data on share prices eventually fades over longer periods, ultimately providing little insight into the future direction of the market. That said, for those of us who are keen on managing our own portfolio, here are two of the most significant but lesser-known economic indicators that can help individual investors think strategically about shifting market conditions. |

#1 Yield Curve
|
|
 An inverted yield curve happens when the U.S. Federal Reserve (Fed) hikes the fed funds rate to beyond the yield of longer-term Treasury securities. So far, this has been a fairly accurate recession signal.
As far as indicators go, the yield curve is an important one as it has historically been a good indicator of a coming recession when it inverts.
On its face, the yield curve is a snapshot of the yields, or expected rates of return, on a collection of bonds of different maturities, from the very short to the very long.
The “curve” is the line you could plot connecting those yields, and its shape can tell us quite a bit about market perceptions of the economy. In fact, an inverted yield curve happens when the U.S. Federal Reserve (Fed) hikes the fed funds rate to beyond the yield of longer-term Treasury securities; so far, this has been a fairly accurate recession signal.
What's in the Curve
The shape of the curve can change as yields fluctuate in response to shifting economic conditions. In general, the short end of the curve is dictated more by the Federal Reserve’s interest rate decisions, while the longer end of the curve reflects investors’ expectations about the future course of inflation and economic growth.
If the economy is growing strongly, the yield curve tends to steepen as investors grow concerned about inflation and potential interest rate hikes by the Fed. As a result, they might start to avoid longer-term bonds, causing their prices to fall and their yields to rise. (But remember: prices and yields move in opposite directions.)
When the Fed does raise interest rates, the yield curve tends to flatten as short-term yields rise and inflation expectations ease.
However, if the Fed raises rates too quickly, causing short-term yields to rise above long-term yields, then the yield curve can invert. That’s when investors start worrying about a potential recession, as high rates slam the brakes on growth and inflation expectations. 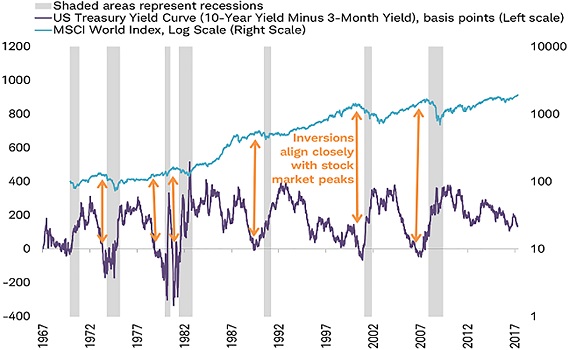 MSCI World Index inception at the start of 1970. (Source: Charles Schwab; Bloomberg data as of 6/7/2017)
|
|
# 2 Leading Economic Index (LEI)
Investors often focus on traditional measures for the economy, like the GDP, as a sign of how the economy is doing, but it’s important to remember that it is a lagging economic indicator.
How so?
GDP reports what has already happened in the economy – and not what’s about to happen. This is why economist market watchers spend more time focusing on the leading indicators, such as the Leading Economic Index (LEI) put out by the conference board.
This index offers a monthly look at 10 subcomponents (including the S&P 500, and the yield spread between) – all of which tend to lead changes in the economy. While the index’s individual components might not mean much on their own, there are times when they all start moving in tandem and markets sometimes follow.
The creation of this index was to pick up major inflection points in the economy and provide a heads-up when there is an elevated risk of a recession, as well as an indication when the economy is coming out of a recession.
The table below takes a broad look at what is covered by the LEI and what it might mean for the economy.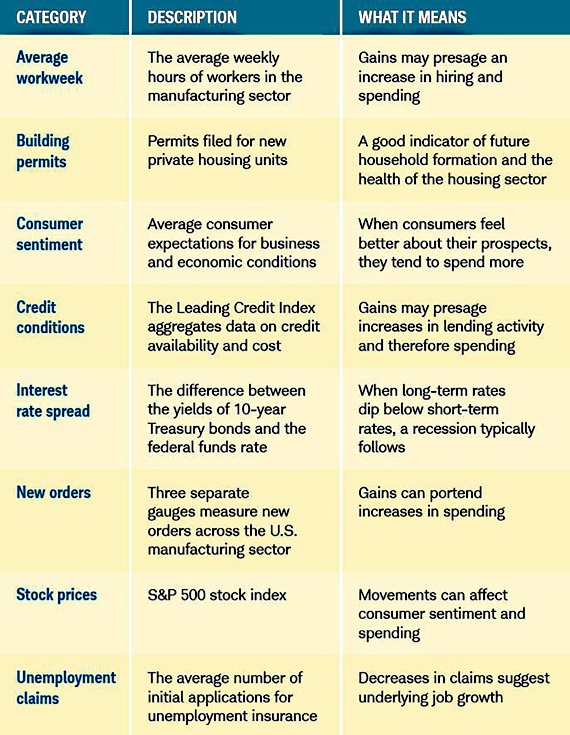
Source: Charles Schwab
| ♦ Planning and Rebalancing |
| Ultimately, any one data point can move markets in the short term, but over the long term, they have much less influence. So, while there is little long-term value in basing your investing plans on the pace of growth, in some cases signals about the health of the economy might prepare you for short-term bouts of volatility. Apart from referring to indicators, investors should formulate and adhere to a long-term investing plan that accounts for their preferred time horizons and risk appetites. Regular planning and rebalancing minimizes the common mistakes driven by crowd psychology and is much more conducive to achieving your personal and long-term investing objectives. |
This article is republished with permission from Dollars and Sense.