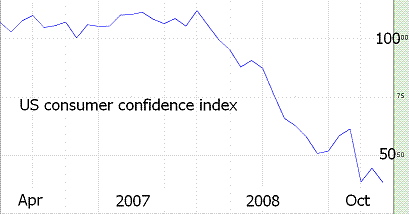
Consumer confidence in the US is still low. Source: www.Bloomberg.com
AS THE bear market continues to extend itself, investors are squinting hard into the future to figure out when stock markets will bottom and start to recover.
Here are some indicators that fund managers look at:
Macroeconomic Indicators
Although the stock market usually turns up several months before the end of a recession, increases in leading economic indicators published by the Conference Board tell fund managers when to plough in cash. These include:
1) Manufacturers' new orders for consumer/capital goods
2) Housing starts, or the number of privately owned new homes on which construction starts
3) Purchasing managers indices (new orders, inventory levels, production, supplier deliveries and the employment environment)
4) Jobs created
5) Money supply
6) Consumer Confidence Index
Other indicators include a rising Baltic Dry Index, which measures prices charged by ocean transportation vessels to ship raw materials; as well as falling inventories of houses for sale and rising mortgage applications.
Technical recovery of leading sectors
Many technical analysts believe the bottom is when certain sectors begin to show absolute or relative strength.
These sectors tend to be the banks, which lubricate the economy, followed by property, consumer cyclicals, technology (especially semiconductors) and transportation.
Basic materials and energy shares are late-stage gainers during bull markets.
CBOE Volatility Index (VIX)

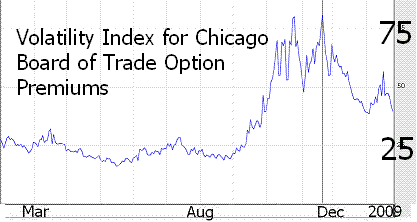
CBOE VIX at all time high is showing unprecedented investor fear. Source: www.Bloomberg.com
An increasingly popular market-timing indicator, the VIX index measures the investor's prediction of near-term market volatility, or risk.
The VIX index measures the implied volatility of premium on stock options traded on the Chicago Board Options Exchange for stocks in the S&P 500.
As option premiums increase when more investors buy put options to hedge their portfolios from market declines, a high VIX reflects increased investor fear and a low VIX suggests complacency.
A rise to 30 in the VIX has predicted a bearish climax in the past. However, the financial crisis of 2008 saw extended readings above this level - as high as 89 in October 2008.
Credit Markets

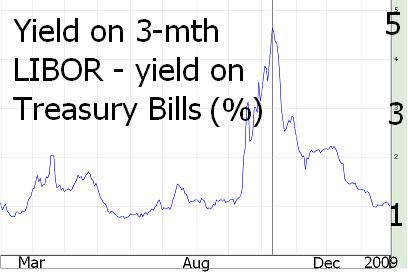
TED-Spread falling below 1% means liquidity crunch is easing. Source: www.Bloomberg.com
* TED Spread
The TED spread is the difference in yields between three-month interbank (LIBOR) loans and three-month U.S. Treasury bills (T-bills).
When financial stress rises and banks become less willing to lend to each other, interbank loan rates climb relative to T-bill rates (seen as risk free).
The wider the spread becomes, the greater the likelihood of a credit crunch that spreads deflationary impulses to the economy.
Historically, spreads over 100 basis points were indicative of a peak, although they did shoot up above 250 basis points during the crash of 1987 and more than 450 basis points during the financial crisis of 2008.
The TED spread is now about 100 basis points, but yields on 3-month T-Bills are also at historical lows or near-zero, meaning the US Treasury can't do much more to increase liquidity.
* Bond-Yield Spreads
When economic stress is elevated and corporations are at greater risk of going bankrupt, yields on their bonds tend to rise relative to government bonds (seen as risk free).
For 'Baa'-rated corporate bonds versus 10-year Treasuries, a widening of spreads to 300 basis points has historically marked a turning point for financial markets. However, spreads did escalate to nearly 400 basis points in 1982 and 550 basis points in 2008.
Other bond spreads are watched too, such as the difference in yields on junk bonds versus government bonds.

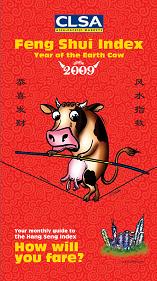
A tongue-in-cheek greeting card turns uncannily spot-on.
The disconcertingly popular CLSA Feng Shui Index
Finally, have a look at the disconcertingly popular CLSA Feng Shui Index, which over the years has been the bane of sensible analysts and investors by correctly calling the market uncannily often.
Its basis is not much more than wind, water, a bunch of fanciful farmyard animals and frequent recourse to spirits.
The CLSA Feng Shui Index started quietly enough as a Chinese New Year card to CLSA clients in 1992 with little more than a distillation of forecasts from some of Hong Kong’s more notable feng shui masters, along with the views of CLSA’s consultant.
The result was a contrarian-looking chart that was easy to laugh off. But six months down the track, the Feng Shui Index was proving to be remarkably accurate. And by end 1992, it had managed to correctly call all seven major turning points of the Hang Seng - unlike most brokers and investors.
Over the years, the index hasn’t always proved to be quite so prescient, but it’s got things right often enough (probably far more often than it ought) to make hard-working analysts despair.
For 2009, here’s what the CLSA Feng Shui Index looks like:
 Will CLSA's fengshui skills prove themselves once again?


