INDONESIA was a bright spot in Best World’s Q1 performance.
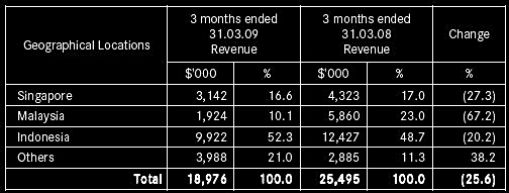
Sales in that market effectively grew 22% (yes, grew. See explanation in Q&A) to $9.9 million, making the country by far the best-performer for Best World.
The customers are rich and not feeling the pinch of the economic slowdown, unlike the target customers in Singapore and Malaysia.
In the latter markets, sales fell sharply.
Overall, Best World’s sales in Q1 fell 25.6% to $19 million, while net profit fell 11.8% to $2 million. Cash flow from operations was a nice $3.42 million.

On a strategy the company is adopting, Huang Ban Chin, an executive director of Best World, told analysts at a briefing: “We have to be sensitive about the times. Previously, we engaged members and tried to make spending per member go up. We now instead try to maintain their spending level and launch new products for them that are value for money.”
The following are some of the questions and answers that arose at the briefing yesterday (May 12):
Q: Receivables have gone up (as at end March ’09) despite lower sales (y-o-y).
A: Fourth quarter sales of last year were lower than Q1 sales of this year. As a result, it’s only natural that receivables went up in Q1.
A thing to understand about our business is that when receivables go down, it means less business. The healthy thing is, receivables are cleared within about 30 days.
Q: I understand that you collect cash when you hand goods over to your distributors. So what are these receivables?
A: The best way to explain this is to think of a vast market such as Indonesia. If you are in a place as far away as Ambon and I am in Jakarta, it’s not possible for you to buy directly from me. You as a distributor will buy from ‘lifestyle centres’. The receivables are between Best World and the ‘lifestyle centres’.
We will collect from the lifestyle centers within a stipulated period of time, irregardless of whether the lifestyle centers have been paid by their distributors. If the lifestyle centres don’t pay us, we will deduct from the commissions they are entitled to.
Q: You have a note in the results announcement regarding Indonesia. Can you explain?
A: We had explained in FY07 results statement that $4.3 million of revenue from Q4 of FY07 was brought forward to 1Q08. If you took that $4.3 million out, 1Q of 09 sales in Indonesia compared to 1Q of 08, actually grew 22%, instead of decline by 20% (as reflected in the above table).
Q: What was the net profit contribution from the $4.3 million sales?
A: It was $0.3 million – we have announced this previously.
Q: Is the end-demand still there in Indonesia?
A: At this point in time, I won’t say it will grow as fast as it has in the past few years. But the demand is still there, compared to Singapore and Malaysia.
Q: What were Indonesian sales in the last three quarters (Q3 and Q4 of 2008 and Q1 of 2009)?
A: The figures are, respectively, $12.7 million, $6.1 million and $9.9 million.
Q: Why did the Malaysian market decline so steeply in Q1 of this year?
A: We are at the upper-end of the market in Indonesia. But in Malaysia, we have the middle-income group. They are tightening their belts

Q: Any products to be launched soon?
A: Typically, we launch more products in Q2 and Q3 than any other quarters. Q1 is low season for us because the distributors take a breather after putting in extra effort in December to meet sales targets. There is also the Chinese New Year period which means shorter work periods, and there are incentive tours and conventions.
In Q2, sales pick up. Q3 is when we launch most of the new products and educate and train the distributors, so that in Q4, the peak season, we don’t want to be taking up their time with education and training.
Q: What update do you have on direct-selling in China?
A: We have to apply for a direct selling licence on our own. The minimum capital is RMB 80 m, of which RMB 20 m has to be put aside as security deposit with the government. We have sufficient funds for that.
We are still strategizing on how to get the licence in the shortest possible time. In the meantime, we are developing the China market in a very conservative manner. We now have distribution centers in China. We are working only with leaders who understand that we will eventually need them to convert their distribution business model to direct selling one day.
Q: What is the outlook for dividends this year?
A: Since listing, our company has given interim and final dividends. There is no reason for us to believe this won’t continue. We can sustain our dividend policy of paying not less than 30% of our net profit. Typically we have paid around 40%. In FY 08, we paid 42%.
Recent story: BEST WORLD, JEL: Interesting shareholders
_____________________________________________________________________________
Comment by dydx as posted on Wallstraits.com:
To me, the most important question concerns Best World's higher Trade & Other Receivables of $12.737m as at 31 Mar 09 (vs. $11.043m as at 31Dec08), against Q1's Rev. of $18.976m.
I have checked the FY08 AR, and under Note 22 in page 79, it shows the figure of $11.043m actually included:
(1) $4.946m of "Other receivables", inclusive $4.208m from Joymain; and
(2) $0.405m of "Tax recoverable" - i.e. actual gross "Trade receivables" (before allowance of impairment) was only $6.057m, which approximates 30 days' sales in Q4-FY08.
Assuming items (1) and (2) remain outstanding as at 31 Mar 09, gross "Trade receivables" would be $7.386m, which is equivalent to 35 days' of Rev. of $18.976m in Q1-FY09.
Based on the above, Best World's "Trade receivables" appear to be in order.


