 YOU MAY RECALL that we put together a 50-stock portfolio at the start of the year using certain metrics: Low PE, low price-to-book, and dividend paying.
We used Bloomberg data to coldly sort stocks and we made no judgement on whether any of the 50 selected stocks should be booted out for whatever reason.
And of course, there were stocks in the list whose fundamentals we were not familiar with. (See: Stock picks for 2014: Will these 50 stocks outperform?)
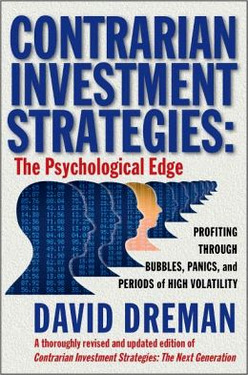
This approach more or less is what some funds, such as start-up Aggregate Asset Management, adopts, and is championed by David Dreman in his best-selling book, Contrarian Investment Strategies, published in 1980.
"I buy stocks when they are battered. I am strict with my discipline. I always buy stocks with low price-earnings ratios, low price-to-book value ratios and higher-than-average yield. Academic studies have shown that a strategy of buying out-of-favor stocks with low PE, price-to-book and price-to-cash flow ratios outperforms the market pretty consistently over long periods of time." – David Dreman
|
|
|
Stock price (SG cts) |
|
|
||||
|
Company Name |
24 Dec 2013 |
End-Mar |
% change |
|
||
|
CHINASING INVESTMENT |
4 |
2 |
-50 |
|
||
|
|
296 |
315 |
6.4 |
|
||
|
ABR HOLDINGS |
76 |
95 |
25 |
|
||
|
WEE HUR |
33 |
35 |
6.1 |
|
||
|
SHANGHAI TURBO |
9.1 |
8 |
-12.1 |
|
||
|
FUJIAN ZHENYUN PLASTICS |
15.6 |
14.2 |
-9.0 |
|
||
|
|
63 |
65.5 |
4.0 |
|
||
|
WING TAI HLDGS |
198 |
183 |
-7.6 |
|
||
|
TUAN SING HLDGS |
29.5 |
33.5 |
13.6 |
|
||
|
LION TECK CHIANG |
77 |
73.5 |
-4.5 |
|
||
|
CHEUNG WOH TECH |
13.5 |
14.5 |
7.4 |
|
||
|
CHINA MINZHONG |
87.5 |
94.5 |
8.0 |
|
||
|
ELLIPSIZ |
8.4 |
8.7 |
3.6 |
|
||
|
SING HOLDINGS |
41 |
35.5 |
-13.4 |
|
||
|
LUM CHANG |
33.5 |
33.5 |
- |
|
||
|
|
14 |
14 |
- |
|
||
|
TRIYARDS |
66 |
64 |
-3.0 |
|
||
|
RICKMERS MARITIME |
28.5 |
28.5 |
- |
|
||
|
FUNG CHOI MEDIA |
10.6 |
10.0 |
-5.7 |
|
||
|
INNOVALUES |
14.8 |
14.9 |
0.7 |
|
||
|
KSH HOLDINGS |
47.5 |
46 |
-3.2 |
|
||
|
|
81 |
91 |
12.3 |
|
||
|
VALUETRONICS |
24.5 |
33 |
34.7 |
|
||
|
UOL GROUP |
611 |
626 |
2.5 |
|
||
|
TA CORP |
38 |
36.5 |
-4.0 |
|
||
|
ENGRO CORP |
102 |
117.5 |
15.2 |
|
||
|
CHINA FISHERY |
38 |
40.5 |
6.7 |
|
||
|
DEVOTION ENERGY |
18.8 |
Delisted |
-- |
|
||
|
SIM LIAN GROUP |
79.5 |
84 |
5.7 |
|
||
|
FRASERS CENTREPOINT |
174.5 |
153.5 |
-12.1 |
|
||
|
PAC ANDES RESOURCES |
13.3 |
12.2 |
-8.3 |
|
||
|
CAMBRIDGE REIT |
68 |
72 |
5.9 |
|
||
|
HONG FOK CORP |
69 |
72.5 |
5.1 |
|
||
|
CHINA MERCHANTS |
92.5 |
96 |
3.8 |
|
||
|
FRASERS COMMERCIAL |
128 |
125.5 |
-2.0 |
|
||
|
SHC CAPITAL ASIA |
15.8 |
20 |
26.6 |
|
||
|
LIPPO MALLS |
39.5 |
40 |
1.3 |
|
||
|
ASL MARINE |
63 |
70 |
11.1 |
|
||
|
|
26 |
27 |
3.8 |
|
||
|
TAT SENG PACKAGING |
27.5 |
32 |
16.4 |
|
||
|
CHIP ENG SENG |
69.5 |
73.5 |
5.8 |
|
||
|
MARCO POLO MARINE |
38.5 |
38.5 |
-- |
|
||
|
UNION STEEL |
10.8 |
10.7 |
0.9 |
|
||
|
TAI SIN ELECTRIC |
31 |
33.5 |
8.1 |
|
||
|
KEPPEL LAND |
337 |
336 |
- |
|
||
|
CAPITARETAIL |
134 |
140 |
4.5 |
|
||
|
|
20.5 |
19.5 |
- 0.5 |
|
||
|
HIAP TONG CORP |
12.3 |
14.2 |
15.4 |
|
||
|
SINARMAS LAND |
47.5 |
57 |
20.0 |
|
||
|
VICPLAS |
7.9 |
8.9 |
12.7 |
|
||
|
|
|
|
||||


