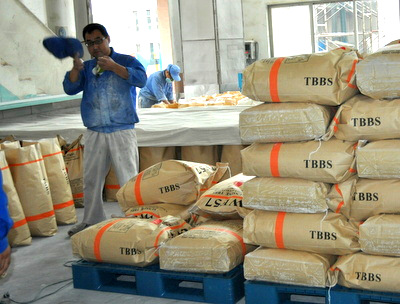
 Rubber accelerators ready to be shipped out from Sunsine's plant. NextInsight file photoThe 2Q2016 profit of China Sunsine Chemical is likely to be higher than 1Q2016, according to 'Portuser' in this article contribution to NextInsight. Rubber accelerators ready to be shipped out from Sunsine's plant. NextInsight file photoThe 2Q2016 profit of China Sunsine Chemical is likely to be higher than 1Q2016, according to 'Portuser' in this article contribution to NextInsight. At "higher than RMB46 m" (compared to the RMB33.6 m achieved in 1Q2016), the expected net profit is premised on two factors:
♦ Ramping up of production, leading to better economies of scale. |
||||
China Sunsine is the world's largest producer of rubber accelerators, China's largest producer of insoluble sulphur, and a significant producer of anti-oxidants. Of the three rubber chemicals, rubber accelerators, along with anti-oxidants, accounted for 90% of Sunsine's 2015 total revenue. Their main input material is aniline which is derived from crude oil.
Record profit in 2014
Sunsine's gross profit surged 84% in 2014 as average selling price (ASP) and sales volume both rose 11%. Tyre factories, seeing stricter enforcement against pollution, bought more from Sunsine, which is known for its green production processes.
That year’s RMB 220m net profit, which would have been higher without one-off expenses, was twice the previous record of RMB 115m in 2010, and thrice the preceding year's RMB 77m.
Setback in 2015
Aniline price dropped 30% in 2015, pulling the ASP down by 15%. Despite the 5% rise in sales volume, gross profit declined 13%:
| Table A | 2013 | 2014 | 2015 |
|
Revenue (RMB m) |
1,696 |
2,077 |
1,859 |
| ASP (RMB/tonne) | 17,200 | 19,100 | 16,200 |
| Sales volume (tonnes) | 98,300 | 109,000 |
114,600 |
|
Gross profit (RMB m) |
308 | 567 | 492 |
| Gross profit margin | 18.2% | 27.3% | 26.5% |
|
Net profit (RMB m) |
77 | 220 | 208 |
Aniline price movement
Aniline price halved, from RMB 11,200 in Aug 14 to RMB 5,300 in Feb 16, as oil price tanked. It has since recovered slightly.
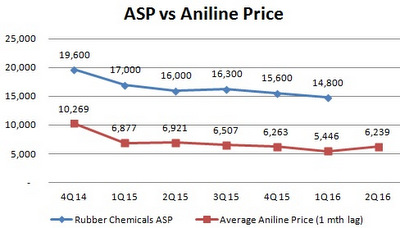
Correlation between ASP and aniline price
A strong correlation exists between ASP and aniline price (as the chart shows)
It should be noted that the selling price that Sunsine sets for an order is recognized later, for example a month later, when the manufactured goods are delivered.
Hence, the RMB 14,800 ASP for 1Q16 (as shown in the chart) was the average set between 1 Dec 15 and 29 Feb 16, rather than between 1 Jan and 31 Mar 16. Also, the RMB 5,446 shown as the 1Q16 average aniline price was in fact for the period between 1 Dec 15 and 29 Feb 16.
1Q16 performance
As shown in the chart, the ASP continued its fall, to reach RMB 14,800 in 1Q16 as aniline price dropped to RMB 5,446. However, higher sales volume enabled Sunsine to report a decent profit (RMB33.6 m) in that quarter:
| Table B | 4Q15 | 1Q16 |
| ASP (RMB m) | 15,600 | 14,800 |
| Sales volume (tonnes) | 29,045 | 30,500 |
| Gross profit (RMB m) | 106.6 | 108.9 |
| Gross profit margin | 23.5% | 24.2% |
| Net profit (RMB m) | 59.6* | 33.6 |
| *There were write-backs of expenses in 4Q15. |
It should be noted that even though first quarter (where the Lunar New Year falls) is the weakest of the four quarters in a year, 1Q16 sales volume was very high, exceeding 4Q15’s and 18% higher than 1Q15’s.
| ♦ Projecting 2Q16 profit | ||||||||||||||||||||||||||||||||||||||||||||||||||||||||
|
As average aniline prices between Mar and May 16 (RMB 6,239) and between Sep and Nov 15 (RMB 6,263) were similar, 4Q15 data may be used to project 2Q16 performance:
The calculations at the end of this article show RMB 46m as a likely profit for 2Q16, on the assumption that the fixed cost is only 11.6% of production cost, as in 2006. The actual percentage should be much higher because of the current low raw material prices and low capacity utilisation (79% in 1Q1, and 75% in 2015). Profit will rise further as production is ramped up. In its 1Q results announcement, Sunsine sounded more upbeat than before when it stated: "International crude oil prices have remained depressed, which has resulted in our main raw material prices remaining at low levels. However, as the China tire industry generally experienced under-utilisation issues during the second half of 2015, which may have depleted their inventory levels, the Group believes that utilisation rate of tire industry will increase starting from 2Q2016, which will indirectly increase the demand for our products, and may have a positive effect on our ASP in subsequent quarters." |
||||||||||||||||||||||||||||||||||||||||||||||||||||||||

Notes:
4Q15 gross profit of RMB 106.6m was from selling 29,045 tonnes at ASP of RMB 15,600 and gross profit margin of 23.5%.
As fixed cost had already been fully factored in the gross profit margin of 23.5% in 4Q15, contribution to gross profit from the incremental sales volume of 4,011 tonnes (33,056 tonnes – 29,045 tonnes [in Table C]) is in excess of 23.5%.
According to Sunsine's IPO prospectus, fixed cost amounted to 11.6% of production cost in 2006. By now, with sharply lower raw material cost, fixed cost’s share of production cost should be much higher.
4Q15 production cost was 76.5% of ASP, as gross profit margin was 23.5%. Fixed cost, even if it were only 11.6% of production cost, is 8.8% (=11.6% * 76.5%) of ASP.
Therefore, 32.3% (=8.8% + 23.5%) of incremental sales revenue flow to 2Q16 gross profit, and the amount is RMB 20.2m (= 32.2% * RMB 15,600/tonne * 4,011 tonnes). Adding this to 4Q15 gross profit of RMB 106.6m gives rise to gross profit of RMB 126.8m, RMB 18.9m higher than 1Q16’s.
After netting off RMB 2.4m (= 4,011 tonnes * RMB 600/tonne) in selling & distribution cost, contribution to pre-tax profit and net profit are RMB 16.5m and RMB 12.4m respectively.
RMB 46m (=RMB 12.4m + RMB 33.6m) is therefore a likely profit for 2Q16.


