|
I'VE INITIATED a small position in Noel Gifts International to test out the strategy I have previously discussed in my post on Design Studio (article here). |

 Noel Gifts International is a leading hampers, flowers and gifts company. It has been in existence for the past 39 years and was listed on the SGX Mainboard in 2008. Photo: CompanyFinancials
Its gross margins over the years have been rather impressive given the relatively low entry barriers that the business operates under. I do not expect them to churn out a gross margin of around 50%.
The problem arises when you start looking at their overhead cost operations, with employee salaries being the main issue, along with other distribution costs. You can take a look at their financial statements to understand better of the situation. In general, the gross profit is barely covering the distribution costs and the employees' cost despite their impressive margins turnover over the past few years.
With overhead costs only going to go up with increases in salaries, the only solution is to increase the volume they sell and improve productivity per worker. We can see a lot of companies doing that on the productivity KPIs these days.
|
The EPS that you see in 2012 and 2013 were inflated due to one-off fair value adjustments on investment properties. Again, this is one aspect of accounting treatment that I have repeatedly emphasized on this blog that may skew the net operating profit after tax (NOPAT). Without accounting for such adjustments, the EPS is rather stable at around 1.50 cents/share.
The company has interestingly been dishing out aggressive dividends of around 1.50 cents/share, which is around what it earns for its core businesses. I can understand why they have maintained the dividends in 2012 and 2013 even when EPS was higher than usual because the gain is mostly on the adjustment which does not impact the cashflow. As far as cashflow is concerned, they are paying out mostly from earnings.
|
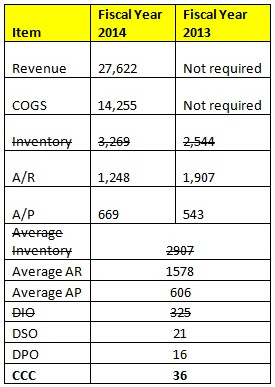 Cash Conversion Cycle
I am curious about the way the business is operating in terms of cash conversion and my initial thoughts have proven to be somewhat right.
As you can see in the table below, the number of days of sales outstanding (DSO) is around 21 days while days of payable outstanding (DPO) is about 16 days. What this means is that the company is churning out their working capital (excluding inventory) just about fine in terms of receivable and payable.
You'd always want to receive money as soon as possible while delaying payments to suppliers as long as possible if you are acting as a business owner and it makes sense because you want to turnaround cash to your advantage as soon as possible.
The reason I have actually struck out the inventory portion is to highlight the business that they are operating under.
As a company operating in the hampers and gifts business, they will always have to stock their inventories in advance and ensure that they re-stock their inventories ahead of the festive demand.
The good thing is most of the inventories will be hardly be obsolete since they can last for some time on the shelf. It is also easy to predict whether business volume is going to increase by checking whether inventory holding has increased or decreased. 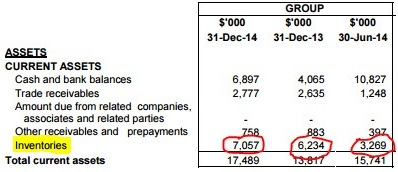 If they are expecting business to increase, we should see a corresponding increase in the inventory, just like what is going to happen in 2015 due to the demand for the SG50 celebrations.
It is important to note that the company is operating under a debt free scenario for a few years now, so the balance sheet looks relatively clean but the return on equity is pretty poor due to the poor turnover of its return on assets, despite the high margin they are churning out.