Following our recent article HOTEL GRAND CENTRAL: 50th anniversary, how much have you made from stock?, a reader wrote to us, presenting a different set of calculations on the long-term gains of the stock.
He is a long-time shareholder of Hotel Grand Central who has kept details pertaining to the company's scrip dividend payments.
The data is not available on the SGX website beyond the past 5 years. Specifically, the information is the price at which new shares were allotted to shareholders opting for scrip dividends. Announcements on the issue prices were made several months after the dividends were proposed and after shareholder approvals were obtained at the AGMs.
What the SGX website has is a summary of dividends declared (for example, 5 cents cash per share) going back a long way -- which was what we used to calculate the dividends accumulated by shareholders who opted for cash payouts.
Hotel Grand Central doesn't archive its announcements on its own website, which is focused on securing customers for its hotel accommodation.
Below is our reader's calculations of your gain if you had opted for scrip dividends when they were available in 2006, 2007, 2009, 2010, 2011, 2012, 2013, 2014, 2015, 2017, and 2018.
In 2016, there was no scrip dividend option -- instead, a 5-cent cash dividend was paid.
Aside from 2016, the years in which cash dividends were the only option were 2004, 2005, 2006 (May), 2007 (May), and 2008. In 2006, scrip dividend shares were issued in Feb, followed by cash-only dividends in May. In 2007, a cash dividend (in May), scrip dividend shares (Oct), and bonus shares (May) were given out.
|
5-year holding period: bought at end 2013 |
10-year holding period: bought at end 2008 |
15-year holding period: bought at end 2003 |
|
|
Share price (on purchase) |
$1.08 |
53 c |
38 c |
|
Capital invested (10,000 shares) |
$10,800 |
$5,300 |
$3,800 |
|
Current number of shares (after scrip dividends) |
12,583 |
16,871 |
20,441 |
|
i) Current share value (@$1.29) |
16,797 |
21,764 |
26,369 |
|
ii) Cash dividends collected |
$565 |
$757 |
$1,660 |
|
Total (i + ii) |
$17,362 |
$22,521 |
$28,029 |
|
% gain |
61% |
325% |
638% |
|
Average gain p.a. |
12.2% |
32.5% |
42.5% |
|
Compounded annual gain |
10% |
15% |
14% |
So the average gain per year was 12.2%, 32.5% and 42.5%, respectively.
In comparison, shareholders who opted for cash dividends each and every time are sitting on lower -- but highly respectable -- average gains per annum: 10.2%, 24.8% and 31.3%, respectively.
| Electing scrip dividends led to higher gains because of: • the reinvestment effect (you are getting extra shares in lieu of cash), • compounding effect (which works marvellously when a company is growing), and • the lower-than-market-price (generally speaking, at a 10% discount) the new shares were allotted at. 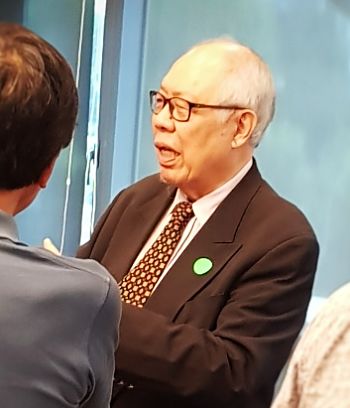 Tan Eng Teong, chairman and MD, Hotel Grand Central, is one of two founding directors of the company, which was born 50 years ago. NextInsight file photo.Obviously, insiders recognise all that. Tan Eng Teong, chairman and MD, Hotel Grand Central, is one of two founding directors of the company, which was born 50 years ago. NextInsight file photo.Obviously, insiders recognise all that. Our reader noted that, for example, the chairman of Hotel Grand Central, Tan Eng Teong, had always opted for scrip dividends. To their credit, the majority of other shareholders were astute enough to do so too. As our reader observed, in the most recent dividend payout in July 2018, 36.22 million new shares were issued at $1.287 apiece with a total value of $46.62 million. For perspective, $55.23 million cash would have been paid out if no shareholder at all opted for scrip. As it turned out, in the July 2018 payout, cash dividends amounted to only $8.61 million. (Sometimes when your holding is small, you won't opt for scrip dividends to avoid receiving odd lots). In percentage terms, in the July 2018 dividend payout, shareholders owning an 84.4% stake in Hotel Grand Central choosing scrips with the remaining shareholders owning a 15.6% stake opting for cash. |