Soo Jin Hou contributed this article to NextInsight. His previous contribution was ALLIANCE MINERAL ASSETS: "Why I say the stock is inexpensive"
|
Is it possible that a company that has grown its revenue at 32% CAGR and net profit at 31% over 4 years enjoys no appreciation in its share price?
* excluding listing expenses Is it because the IPO was priced so high that growth was already factored in? Unlikely. In the IPO prospectus, the company guided that the offer price was to be set between HK$1.33 and HK$1.73. |
Valuation
Investment parameters are:
|
Stock price |
HK$1.27 |
|
52-week range |
HK$1.18 – $1.97 |
|
PE |
3.8 |
|
Market cap |
HK$913 m |
|
Shares outstanding |
719 m |
|
Dividend |
1.86% |
|
Year-to-date return |
-19% |
|
Source: Bloomberg |
|
PE ttm=3.9
Core PE ttm=4.5 #
Core EV/EBIT=6.5 #
ROE=12.8%
ROIC=20.6%
Price to book=0.51
Dividend yield=1.8%
FCF/market cap ttm=32% *
FCF/EV ttm=23% *
Market capitalization=HK$949m
Net gearing=22%
# Core denotes net profit minus other income
* FCF computed using net cash flow from operation minus purchase of plant and equipment
The parameters related to EV are actually better than they seem due to a distortion from the issuance of debt notes on 25/6/2015 and the usage of this debt. This is discussed later in detail. In my study, trade financing is regarded as trade payable.
Even though interest is imposed, and should arguably be treated as borrowings, a significant portion of it is secured through pledging trade receivables. In the Annual Report 2015, the sum of trade payable and trade financing for 2014, was exactly the same as the trade payable in Annual Report 2014, thus confirming that trade financing is indeed trade payable.
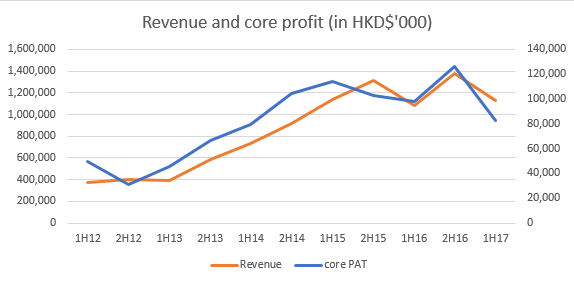
The chart shows revenue grew rapidly from 2012 to 2015. It flattened from 2016, and in the latest 1H17 report, core profit was down slightly.
But so what? After excluding a gain from the repurchase of notes of HK$7.7m and a forex gain of HK$15.4m, the company still booked a commendable HK$82.7m profit, equivalent to 11.5 cents per share.
That translates into an annualized PE of just 5.7, and that from a seasonally low 1H.
Are they legit?
Since the company is trading at distressed valuations, is it or the industry in distress? Or perhaps, since it is listed in HK, is it a shady Chinese company that nobody trusts?
“We are one of the leading one-stop precision engineering solutions providers serving a wide range of industries worldwide. Our Group’s core businesses include supplying precision engineering solutions, Computer Numeric Control (“CNC”) machining centres, and components and parts, as well as providing comprehensive maintenance and after-sales technical support. We serve over 200 diversified customers and our customer base spans across various industries, including precision machine tool engineering, electronics/semi-conductor, automotive, oil and gas, marine, construction materials, as well as niche markets in aerospace, medical and renewable energy. Our business covers markets in European countries such as Germany and Switzerland, as well as in the Asia-Pacific region such as the People’s Republic of China (the “PRC”), Southeast Asia, Japan and India.”
Out of its 5 business segments, precision engineering solution projects contribute the lion's share of revenue. In 2016, that segment contributed 91.8% of revenue, and for 1H17, 94.6%.
Interestingly, CW Group disclosed the identity of its top customers: Welea Solutions (Malaysia), Siam Technos (Thailand), PT Buana Prima Raya (Indonesia), Japan Machine Tools Asia (Japan), PT Abadi Toolsindo (Indonesia) and Wuxi Best Precision Machinery (China).
Except Wuxi, the customers are privately-held entities.
Wuxi’s contribution has been dropping off and China no longer contributed substantially to the company’s topline since 2015. With my access to the Companies Commission of Malaysia, I’ve found out that Welea is a negative equity company, was loss making in 2015 and 2016, and recorded revenue of only RM1.45m in 2016.
Inexplicably, according to CW Group, sales to Welea was HK$668m or about RM349m in 2016. The opacity of the customer’s operation and finances makes it difficult to gauge their ability to meet their payment to CW, and difficult to understand what exactly are CW selling to their customers.
Strangely, none of the customers highlighted in a bond review report “Are CW Group’s New 7% 3Y Bonds Attractive?” are named as major customers. They are Rolls-Royce, Honeywell, Hewlett Packard and Hamilton Sunstrand.
I speculate that CW’s customers are just conduits to multinational companies, and they are responsible for lower value support jobs while CW does the heavy lifting in design, manufacturing and sourcing. That may explain the huge discrepancy between the revenue of Welea vs what CW claimed was sold to Welea.
On the opposite side of the supply chain, CW has collaborated with a list of foreign equipment specialists that include Kiwa Machinery Co (Japan), Zuse Holding GmbH (Germany), Fair Friend Group (Taiwan) and Deckel Maho Pfronten Gildemeoster GmbH (Germany). They are relatable and identifiable corporate entities.
CW Group was inducted into Forbes Asia’s Best Under A Billion in 2015.
On 24/10/17, the company announced the receipt of a S$8.9m grant from the Singapore government to build a utility scale energy storage facility to improve on the intermittency of renewable sources of energy.
The most important stamp of legitimacy was when the company placed out 15% of its share capital to Shenzhen Hua Hang Xin Investment Center Limited Partnership at HK$3.63, almost 3 times the current price, on 17/11/2015. Hua Hang Xin’s subscription came with a board seat. Hua Hang Xin is owned by AVIC Trust Co Ltd, which is controlled by AVIC Capital.
AVIC Capital is a Shanghai listed company controlled by AVIC, or Aviation Industry Corporation of China, which is a large state-owned enterprise controlled by the central government. According to the company’s website, AVIC has over 100 subsidiaries, 27 listed companies and more than 450,000 employees.
Does AVIC’s interest in CW Group imply that CW has significant businesses in the aviation industry? Unfortunately, the company does not break down its revenue according to industry.
Receivables
CW’s weak share price performance, in my opinion, is partly due to investor concerns regarding the recoverability of its trade receivables. I believe the market is pricing in some impairment on the receivables. This concern has prompted auditor Ernst and Young to remark that overdue trade receivables represent 23% of total trade receivables as at 31/12/2016.
The capital-intensive nature of equipment manufacturing often means long receivables turnover days. The customer is not billed after the equipment is shipped, but only after set-up, troubleshooting, qualifying and commissioning. Unfortunately, the more complex the equipment, the longer it takes to get the tool up. Customers also tend to delay payment on the concern that technical support may deteriorate once payment is received.
To be sure, trade receivables have grown 3 times since CW Group's listing. 1H17 saw another significant jump to a historical high of HK$2.3b. Excluding 1H17, trade receivables as a fraction of revenue has always been somewhat rangebound since listing.
|
In HK$’000 |
2012 |
2013 |
2014 |
2015 |
2016 |
1H17 |
|
|
Receivables turnover days |
267 |
273 |
202 |
169 |
259 |
|
|
|
Trade receivables |
625,823 |
972,283 |
1,413,172 |
1,413,172 |
2,075,259 |
2,269,740 |
|
|
Trade receivables / Revenue |
1.56 |
1.67 |
1.53 |
1.07 |
1.50 |
2.01 |
|
A closer analysis on overdue receivables as a fraction of billed receivables shows that the overdue receivables in 2016, while high, isn’t particularly extraordinary compared to an even higher ratio in 2013.
Impairment of receivables are recognized in "other expenses". Except for year 2016/2015, this item was not broken out. Still, even in the worst-case scenario, which is to assume that the entire "other expenses" to be solely for the impairment of receivables, there has never been significant impairment in the past.
Past due but not impaired:
|
In HK$’000 |
2011 |
2012 |
2013 |
2014 |
2015 |
2016 |
|
< 3 months |
60,023 |
60,126 |
184,472 |
190,484 |
306,207 |
350,282 |
|
3-6 months |
53,712 |
8,203 |
179,879 |
13,111 |
32,771 |
132,182 |
|
6-12 months |
21,990 |
16,041 |
72,775 |
23,996 |
755 |
3,970 |
|
> 12 months |
1,009 |
11,892 |
16,231 |
461 |
346 |
537 |
|
Total |
138,734 |
96,262 |
453,357 |
228,052 |
340,079 |
486,971 |
|
Billed Receivables |
461,912 |
534,481 |
854,290 |
677,061 |
1,413,172 |
1,137,080 |
|
Ratio |
0.30 |
0.18 |
0.53 |
0.34 |
0.24 |
0.43 |
|
Other expenses |
-745 |
-15,720 |
0 |
-2,908 |
0 |
0 |
Of course, the large receivables is a point of contention but an analysis of past reports give credence that they can be recovered, even though it may takes a long time to do so.
Free cash flow
Ironically, the large increase in receivables over the past 12 months occured just as the company was starting to see healthy free cash flow. Excluding non-operational investment, i.e a project investment to the tune of HK$385m and M&A related cash movement, free cash flow for the past 12 months amounted to 32% of market cap.
Even after accounting for debt, it is 23% of EV. Free cash flow is computed using net cash flow from operating activities minus purchase of plant and equipment and payments for patents and trademarks.
From 2012 to 2015, when high growth was achieved, CW generated HK$868m cash from operation before working capital changes, almost its current market capitalization, but ended with negative HK$18m after working capital changes. I do not think that the negative net cashflow from operation is cause for alarm because revenue was growing at a CAGR of 47%. Expenditure on plant and equipment over the 4 years is very low at only HK$38m. Incredibly, CW only carries HK$9.6m of plant and equipment on its book.
However, from 2H15 to 2H16, CW spent a total of HK$147m for patents and trademarks. For such a huge expenditure, it is very disappointing that management did not disclose details. I’ve assumed that this expenditure is operational, but judging from its size and that it has no prior occurrence, it may very well be an investment for new income stream.
Debt
CW has largely been net cash (excluding trade financing) from 2012 to 2014 despite growing at a rapid pace. On 25/6/2015, CW issued S$75m (approximately HK$408m) 7% 3-year notes, and that is how the debt came about. Shortly after that, it announced its intention to pursue M&A opportunities in Europe.
To do that, it deposited cash into an escrow fund. As at 1H17, CW has spent HK$336m on the potential acquisition. That is almost the amount raised from the debt notes. Also, in 1H17, HK$385m were used for project investment. Unfortunately, no detail is disclosed in the report over this large sum.
The sum of both expenditure is HK$721m, which is much higher than the debt paper. It can be argued, therefore, that the debt has not been utilized for the core operation and by adding it the debt to valuation parameters such as EV/EBIT, it makes it worse than it seems. To be fair, CW has nothing to show yet for the large expenditures incurred, and it will be a key risk moving forward whether these expenditures will come to fruition.
Nevertheless, the company is cognizant that the debt paper is trading at distressed level (at 15% yield) and has commenced voluntary bond repurchase. As at 11/10/17, S$19.75m has been repurchased and cancelled.
While the expenditure for M&A and project investment are not operational, if they are included in the computation of free cash flow, free cash flow is an abysmal negative HK$573m since listing.
|
Investment thesis
|