| Nordic Group, after announcing a 22% rise in its 1H17 profit to $6.5 million, gave a keen insight into its growth potential. In a chart released with its PowerPoint presentation, Nordic projected a net profit of $15.2 million for this year. It is a record high and follows on last year's record profit. If achieved, the 2017 net profit would represent 20% y-o-y growth, which is what Nordic targets internally for the next five years. 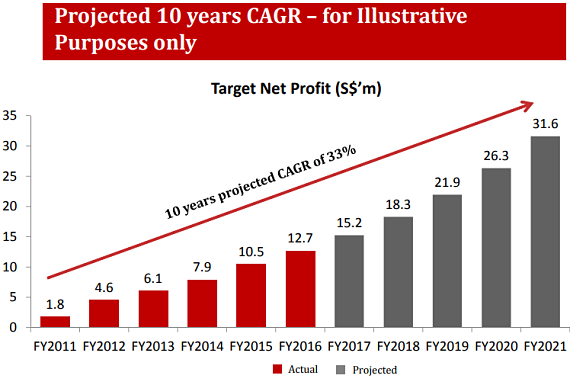 CAGR projection is based on internal target net profit growth of 20% per annum and supported by extrapolation from last 5 years actual growth trend. CAGR projection is based on internal target net profit growth of 20% per annum and supported by extrapolation from last 5 years actual growth trend. No assurance can be given that future events may occur, that projections will be achieved, or that the Company’s assumptions are correct. Actual results may differ materially from those which may be projected. (Nordic's disclaimer) "We have the building blocks in place for this year's and next year's growth, such as the recent acquisition of Ensure Engineering and the consolidation of our marine, O&G business in China and downsizing the marine, O&G business in Singapore, and the investment in carbon papers that have yet to be realised, etc," says Nordic executive chairman Chang Yeh Hong.  Chang Yeh Hong, executive chairman of Nordic Group. Photo: Leong Chan TeikPlus, of course, the strong orderbook for its core businesses. (more on this later) Chang Yeh Hong, executive chairman of Nordic Group. Photo: Leong Chan TeikPlus, of course, the strong orderbook for its core businesses. (more on this later)At a 20% growth rate, by Year 5, ie 2021, its profit would have doubled to $31.6 million from this year's projected $15.2 million. Not unreasonably, the market cap of Nordic can be expected to double too. These were the unspoken numbers that Mr Chang had in mind when he said at a recent interview with SGX's Jennifer Tan: "Since our 2010 listing, our market cap has grown more than seven-fold - from S$22 million to S$165 million. We hope to double our market cap again in the next five years." (See SGX article: NORDIC GROUP: Lays Building Blocks for Growth) |
Mr Chang notes, at a 1H2017 results briefing this week, that what would be needed to fuel growth from 2019 would be an acquisition, for example, or a sharp recovery in Nordic's marine and O&G business. @ 2Q17 results briefing. Photo by Colin Lum
|
S$’m |
1HFY17 |
2HFY16 |
Change |
|
Revenue |
44.0 |
41.6 |
6% |
|
Gross profit |
14.2 |
13.2 |
8% |
|
Gross profit margin |
32.2% |
31.6% |
0.6 ppts |
|
Operating expenses |
(5.3) |
(5.7) |
(6%) |
|
Net profit after tax |
6.5 |
5.4 |
22% |
Another insight shared by Nordic - for the first time - is its estimate of the value of the maintenance contracts it has with several petrochem clients.
These maintenance contracts are based on unit rates and do not have fixed upfront contract values.
To guide investors better, Nordic decided to use data from its track record with these clients and project its revenue for current contracts.
|
Nordic's order book |
|
|
Maintenance |
$86.9 m |
|
Projects |
$24.6 m |
|
Total |
$111.5 m |
Thus, Nordic's estimate is $86.9 million for maintenance contracts to be realised over 2-3 years.
Aside from maintenance contracts, Nordic's orderbook comprises projects which have fixed values. These amount to $24.6 million.
As of end-June 2017, the total orderbook: $111.5 million.
| What enables Nordic to project -- quite confidently -- its future earnings is simply the relative stability and recurring nature of its maintenance contracts. These contracts revolve mainly around scaffolding, insulation and engineering services. If indeed Nordic achieves 20% growth every year, by Year 5, its stock price would roughly double to 84 cents, assuming there is no PE ratio expansion.
It also pays out dividends, with a trailing yield of 3.4%. Nordic has a dividend policy of paying out 40% of its net earnings as dividends. For Nordic's 2Q presentation materials, click here. |
||||||||||||||||