The Trendlines Group reported a net profit of US$2.4 million for the second quarter of 2017. 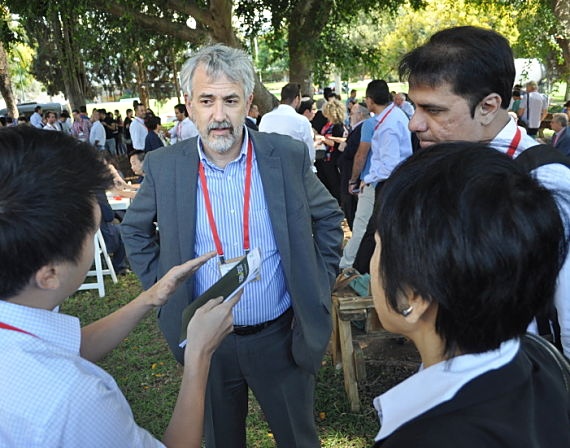 Co-Chairman and Co-CEO Steve Rhodes with Singapore investors attending a Trendlines event in Israel.
NextInsight file photo.The profit stems largely from a gain in the fair value of investments in its portfolio companies, which "demonstrates that our companies are making significant commercial and technological progress and that this progress is validated through increased valuations in follow-on financing rounds," said Steve Rhodes, Chairman and CEO of Trendlines.
In 2Q2017, Trendlines exited from BioSight with a 217X return on investment and 71% internal rate of return (IRR).
In its 2Q2017 results announcement, Trendlines, for the first time, made available a table of the returns and IRRs from all seven of its exits to date.
|
Exit |
Company/Description |
Acquirer |
Estimated Return(1) |
IRR (%) |
|
2017 |
BioSight |
Arkin Bio Ventures LP |
216.7 X |
71 |
|
2016 |
E.T.View Medical |
Ambu A/S |
1.2 X |
5 |
|
2014 |
Most Valuable Portfolio Company (MVPC)(3) |
Undisclosed |
79.1 X(2) |
80 |
|
2014 |
Inspiro Medical |
OPKO Health |
8.8 X |
131 |
|
2013 |
InnoLap Surgical |
Teleflex, Inc. |
3.2 X |
447 |
|
2013 |
FlowSense Medical |
Baxter Int’l |
4.0 X |
280 |
|
2011 |
PolyTouch Medical |
Covidien Ltd. |
6.7 X |
289 |
|
Weighted average |
|
|
10.6 X |
101 |
|
|
||||
Notably, the exit value of all 7 exits was, on average, 3.5X their carrying value on the eve of exit.
This means that the current book value of Trendlines portfolio of companies is likely to be conservatively estimated and could be worth a few multiples higher on exit.
Based on a stock price of 14.5 cents, the market cap of Trendlines is currently S$74 million (or US$55 million), a discount to the book value (US$87.6 million).
For more on the 2Q2017 results, click here for the Powerpoint materials.
| Q: About half of your total portfolio value, US$43.8 million as at 30 June 2017, is found in your “Most Valuable Portfolio Company.” How was this value derived and what can you tell us about it? A: In 2014, this portfolio company completed a sale of substantially all of its assets relating to a medical device product to a multinational corporation. The sale was for cash, milestone payments, and – significantly – for royalties from the sale of the product when it comes to market. Due to the significant value of this asset, an external valuation of this company is performed on a quarterly basis by a company that specializes in valuations of medical device companies. The US$43.8 million Q2 2017 valuation represents the net present value of our share of estimated future royalty payments, after adjusting the cash flow to take account of multiple risk factors, including market risk, manufacturing risk, and product risk, and then applying a financial discount rate. It should be noted that in June 2017 we were advised by the acquirer of the assets that it is establishing a high-volume manufacturing facility for the production of the product and is on schedule to release the product in 2018. Source: Trendlines' 7 Aug 2017 "Frequently Asked Questions about Our Financial Statements" |