Almost two years it has been since our nasi lemak portfolio was first laid before your eyes.
Back then, reflecting the uncertainty that all stock picks start life with, the article headline had a tentative tone: Nasi Lemak Portfolio: Will it turn out spicy and nice?
Today, the portfolio has turned out very well, thank you. It's a sweet 143% gain on average for 19 stock picks.
| No. of stock picks: 19 Gainers: 14 Losers: 5 Average $ gain: + 143% |
The portfolio, for those who are new to this, was initially cobbled together after a hearty meal of nasi lemak (and mee rebus) in MacPherson by six investors.
Each investor threw out a name or two along with a brief elevator pitch.
Since then, the portfolio, which began life in Aug 2015, has seen several stock purchases and sales along the way. It looks as follows now: 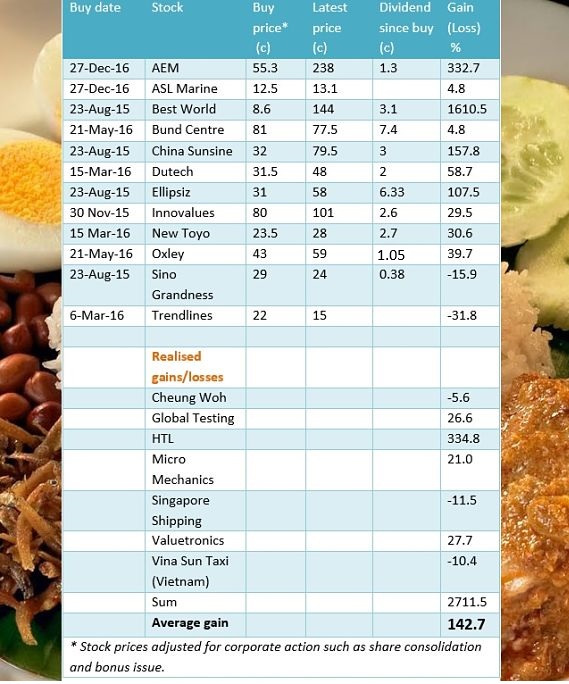
For simplicity, the average gain of 143 % is based on each stock's current price (or realised price) and initial entry price, and dividends received, if any.
That is, each stock had equal weightage in the portfolio and the stock's holding period was not a factor in calculating the gain/loss.
Out of the 19 stock picks, 14 has made gains. There were outsized gainers without outsized losses.
Best World International, with its 1,611% gain, was an outlier that comes your way once in a blue moon -- if at all.
Its share price has sizzled after it was awarded a direct-selling licence by the Chinese authorities and after, simply, delivering strong profit numbers for 2016 and 1Q2017.
|
Aug 2015 |
Buy price: 21.5 c |
|
Sept 2015-Aug 2016 |
4 cents dividends |
|
Sept 2016: 1 for 4 bonus issue |
Adjusted original buy price: 17.2 c |
|
May 2017 |
3 cents dividend |
|
May 2017: 2 for 1 stock split |
Adjusted original buy price: 8.6 c |
In case anyone is surprised by the low buy price (8.6 cents) shown in the table, we show the effects of corporate action on the actual original purchase price of 21.5 cents (see table). Ditto for the dividends.
What if we strip out Best World from the overall calculation of the portfolio gain? In its absence, the average stock gain was 61%, still a fantastic return.
HTL and AEM were the other two outperformers.
HTL's share price shot up 335% on a takeover offer by a Chinese party while AEM's stock surged 333% as its business ramped up deliveries of its new proprietary chip-testing machine to Intel.
This is the last article on the portfolio.
In its place, we are calling for stock ideas from "good" investors to form a brand-new portfolio.
You are welcomed to post a stock idea (with a brief rationale) in the Comments section below, and we will consider it for inclusion.
Look out for an article to be published in July 2017. Meantime, as before, the following applies:
Cautionary note: The Nasi Lemak portfolio reflects the diverse investment interests and perspectives of several investors, each of whom has other stocks not revealed in this article. The point is, these investors' risk profiles and investment objectives are not fully known and may differ from yours.