Republished from ThumbTackInvestor with permission
|
This has gotta be one of the most well managed, yet low profile company on SGX. Well, at least until recently when analysts finally started reporting on it. I was hoping to accumulate more but with the recent huge run up in the share price, I guess I’d have to reanalyze and rethink my position. |
Brief Background
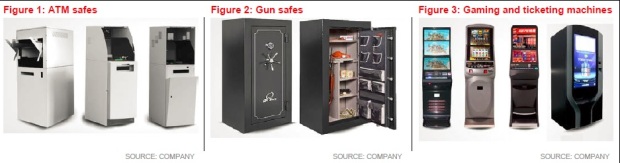
Dutech is Asia’s largest safe manufacturer in terms of sales and production capacity. They are also one of the few global players who are both UL and CEN certified, with their production bases in China and Germany. Its key products include ATM safes, gun safes, commercial safes and cash handling systems.
There are 2 main divisions: High Security segment (which manufactures ATMs, gun safes, commercial safes, cash handling systems and gaming terminals), and the Business Solutions segment (which manufactures intelligent terminals and electro-mechanical equipment to semi-conductor, printing and automotive industries)
Dutech’s clients include Hitachi, Diebold Nixdorf,Liberty Safe & Security Products Inc., Tractor Supply Co., Costco Co., Glory Ltd., SGI, Bauhaus, Schaefer Shop, Trumpf, and Amada.
Recent Developments
In 2011, Dutech acquired Format, which was Dutech’s competitor. After the acquisition, Dutech set about integrating the loss making company and in a short 3 years, managed to finally make it profitable.
Dutech then embarked on yet another acquisition in 2014, this time acquiring Deutsche Mechatronics GmbH (DTMT), a manufacturer as well as provider of drying solution for graphics and printing industries, intelligent terminals, visual quality control machines, and other sheet metal products.
DTMT has allowed Dutech to further enter the intelligent terminals business. (under Business Solutions segment)
Most recently, in Dec 2015, Dutech bought Krauth from Nussbaum Technologie for 220k euros. They also bought the know-how for 250k euros, and invested a further 2.02mil euros into Krauth. Krauth, established in 1926, is a developer and producer of solution products such as Auto-Ticketing Machines and Money Changers.
It is clear to me that Dutech is pushing for growth into the intelligent terminals sector. This is a sector which is relatively niche, and with their crafty acquisitions, Dutech has carved out a space for itself in this sector. Dutech has also shown that they are able to assimilate and turn around acquisitions, something which is crucial for companies that are growing inorganically.
With proper integration, the acquisition can then contribute positively to earnings under the umbrella of companies. Each of Dutech’s acquisitions bring some additional know-how to the table, and increases Dutech’s competitive moat.
Another point to note is that Dutech’s sales are mainly in USD, while their costs are in RMB. Hence, a strengthening USD environment vs the RMB is hugely beneficial to Dutech.
Competitive moat

UL and CEN certified production is IMO, a major competitive edge for Dutech. Afterall, manufacturing typically has relatively low barriers to entry and anyone can copy that. But getting UL and CEN certification is not easy, and requires substantial investments. UL certification for example, is a fairly long process which can easily take several months to complete. A clear sign of how hard it is to get both UL and CEN certification is the fact that Dutech remains one of the few safe manufacturers that are dually certified.
This is a chart showing how the process of getting UL Certification:
On top of this, Dutech’s acquisitions have given them valuable know how in the intelligent terminals sector. Manufacturing of such intelligent terminals requires specific industry knowledge, expertise and personnel. All of which would mean that competitors would find it hard to undermine Dutech.
Income Statement
| (RMB'000) | FY11 | FY12 | FY13 | FY14 | FY15 |
| Revenue | 428,762 | 711,707 | 1,027,584 | 1,050,913 | 1,193,748 |
| Cost of Sales | -334,489 | -556,666 | -783,991 | -794,269 | -851,838 |
| Gross Profit | 94,273 | 155,041 | 243,593 | 256,644 | 341,910 |
| GPM (%) | 21.99% | 21.78% | 23.71% | 24.42% | 28.64% |
| Net (Loss)/Profit After Tax | 34,052 | 40,270 | 100,357 | 142,697 | 118,000 |
| (Loss)/profit attributable to: Equity holders of the Company | 34,052 | 40,270 | 100,357 | 145,456 | 118,000 |
| (Loss)/profit attributable to: Non-controlling interests |
- | - | - | -2,759 | - |
| Net Profit Margin | 7.94% | 5.66% | 9.77% | 13.84% | 9.88% |
| Earnings per share (RMB cents) | 10.16 | 11.29 | 28.15 | 40.02 | 33.1 |
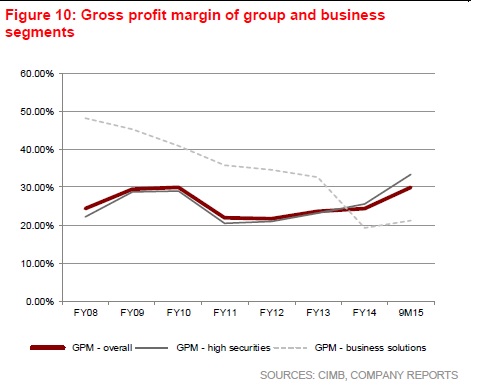
As one can see, Dutech enjoys relatively high GPM and NPMs; and these margins have increased even further in the past 2 years, because of the drop in steel prices. Steel forms the bulk of the material costs for Dutech.
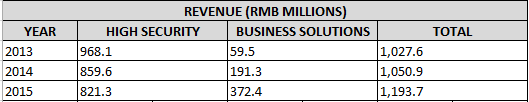
The above breakdown of the revenue over the past 3 yrs show that although the High Security segment is still the main contributor to revenue, the Business Solutions segment has steadily been increasing.
This is consistent with the acquisitions made most recently. Going forward, I think it is fairly obvious that Dutech would continue to focus on the Business Solutions segment, while the High Security segment would still be the main contributor to revenue for a few more years. I cannot find sufficient data on this, but I suspect the margins for the Business Solutions segment is higher.
Condensed Balance Sheet
| (RMB'000) | FY11 | FY12 | FY13 | FY14 | FY15 |
| ASSETS | |||||
| Non-current: | |||||
| Intangible assets | 20,614 | 22,078 | 20,782 | 15,498 | 10,037 |
| Total Non-current: | 176,769 | 185,481 | 193,125 | 319,599 | 333,586 |
| Current: | |||||
| Cash and bank balances | 150,649 | 100,851 | 168,762 | 77,813 | 240,444 |
| Trade receivables | 80,354 | 110,696 | 148,160 | 164,728 | 196,226 |
| Total Current: | 326,441 | 333,686 | 463,182 | 517,580 | 619,259 |
| TOTAL ASSETS: | 503,210 | 519,167 | 656,307 | 837,179 | 952,845 |
| LIABILITIES AND EQUITY | |||||
| Non-Current: | |||||
| Long-term borrowing | - | - | - | 7,426 | 8,714 |
| Other payables | 19,718 | 23,283 | - | 5,285 | 2,565 |
| Total Non-current: | 26,218 | 37,415 | 14,136 | 27,063 | 42,631 |
| Current: | |||||
| Borrowings | 61,503 | 10,871 | 12,469 | 35,449 | 46,229 |
| Trade payables | 56,171 | 76,506 | 99,139 | 82,969 | 75,934 |
| Other payables and accruals | 17,155 | 29,773 | 57,940 | 71,720 | 83,056 |
| Total Current: | 139,094 | 120,933 | 179,444 | 205,229 | 216,431 |
| Total Liabilities: | 165,312 | 158,348 | 193,580 | 232,292 | 259,062 |
| Share Capital | 168,067 | 168,067 | 168,067 | 168,067 | 168,067 |
| Non-controlling interests | - | - | - | 8,891 | - |
| Total Equity | 337,898 | 360,819 | 462,727 | 604,887 | 693,783 |
This is a condensed balance sheet. Intangible assets relate mostly to goodwill from Dutech’s acquisitions. Dutech has been conservative in their accounting, and as seen above, they have been amortizing the intangibles yearly.
Cash holdings have also increased substantially. In fact, as of the most recent quarter, FY16Q1, cash holdings is now 289 million RMB.
To illustrate how well capitalized Dutech is, with just the cash holdings of 289 million RMB, Dutech can actually pay off ALL of its current liabilities, including all payables, as well as all its long term borrowings.
In other words, Dutech can completely wipe off almost ALL its liabilities with just the cash on hand.
Condensed Cashflow
| (RMB'000) | FY10 | FY11 | FY12 | FY13 | FY14 | FY15 |
| Cash flow from operating activities: | ||||||
| Operating profit before working capital changes | 51,720 | 68,273 | 109,979 | 116,666 | 163,773 | |
| Cash generated from operations | 32,281 | 52,193 | 89,925 | 116,837 | 131,110 | |
| Income tax paid | -5,446 | -7,662 | -13,950 | -14,571 | -20,782 | |
| Net cash generated from operating activities | 78,385 | 26,835 | 44,531 | 75,975 | 102,790 | 110,328 |
| Free Cash Flow | 42,154 | -40,177 | 8,202 | 48,231 | 28,865 | 77,527 |
| Cash flow from investing activities: | ||||||
| Purchase of property, plant and equipment | -25,131 | -30,984 | -31,322 | -24,190 | -55,065 | -32,801 |
| Purchase of land use rights | -11,100 | -36,028 | - | - | -18,860 | 0 |
| Development costs incurred | - | - | -5,007 | -3,554 | - | - |
| Net cash used in investing activities | -36,999 | - 68,192 | -24,186 | -11,717 | -158,896 | 65,137 |
| Cash flow from financing activities: | ||||||
| Net cash (used in)/generated from financing activities | 5,779 | -16,671 | 1,826 | -39,608 | 2,480 | |
| Net (decrease)/increase in cash and cash equivalents | -35,578 | 3,674 | 66,084 | -85,931 | 177,945 | |
| Effects of exchange rate changes in cash and cash equivalents | -5,498 | 1,802 | -595 | -2,545 | 1,595 | |
| Cash and cash equivalents at the beginning of financial year | 119,290 | 78,237 | 83,713 | 149,202 | 60,726 | |
| Cash and cash equivalents at the end of financial year | 78,214 | 83,713 | 149,202 | 60,726 | 240,266 |
As one can see, Dutech generally has nice FCF every year. The only capex that’s needed is mainly to purchase machinery and replaceable parts for their manufacturing plants. This is fairly consistent at approximately RMB30-35 mil every year.
| FY11 | FY12 | FY13 | FY14 | FY15 | FY16 | |
| Shares outstanding | 356.5m | 356.5m | 356.5m | 356.5m | 356.5m | 356.5m |
| NAV/Book value (RMB cents) | 54.63 | 101.20 | 129.78 | 169.66 | 194.59 | 207.95 |
| ROE (Profit / Equity) | 10.08% | 11.16% | 21.69% | 24.05% | 17.01% | |
| Total Dividends (SG cents) | 1.00 | 0.00 | 0.00 | 1.00 | 1.50 | 1.00 |
The growth in Dutech’s book value has been pretty amazing. Almost quadrupled in 5 years. ROE has been in the high teens to 20s in recent years. The track record of dividends though, has been patchy. I am guessing even though Dutech has a large cash hoard and is cashflow +Ve, the management wants to use the cash for further acquisitions and growth. This is something I’m ok with as long as they can show results.
My thoughts
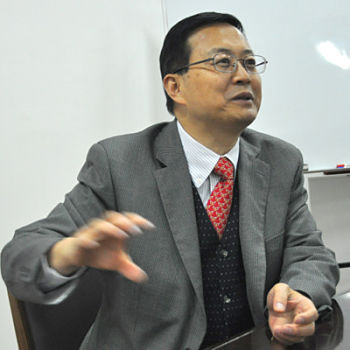 CEO Dr Johnny Liu. NextInsight file photoMy investment thesis back in 2015, revolves around the strong competitive moat that the company has, its stellar and relatively diversified customer base and the large discount to book value then.
The fact that it was considered an S chip did bring up some caution, but ultimately what convinced me was the low remuneration that the CEO paid himself. Dr Johnny Liu’s remuneration was only $370k in 2013, and $200k in 2014. This is rather low compared to other CEOs who have underperformed Dr Johnny Liu.
I also like the fact that the he owns a sizable part of the company through his own investment vehicle.
Updates
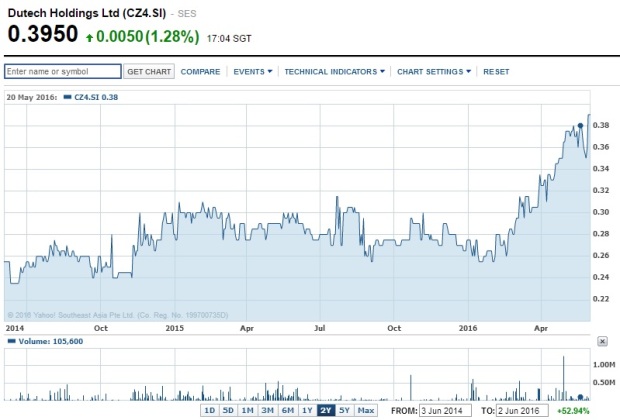
As of today (06/06/2016), Dutech’s share price suddenly shot up 15% in a single day. Obviously the share price is now quite different from when I first started this post about a week ago. I am told the sudden rise is due to CIMB’s newly released buy recommendation on Dutech. I have no arguments with that except that as usual, analysts tend to recommend stocks AFTER it has risen substantially. Sure, there’s still profit to be made, but certainly not that of a deep value, contrarian investment.
Also, I’ve mentioned that I do utilise TA for short term analysis. In this particular instance, TA did help me hold on to Dutech:
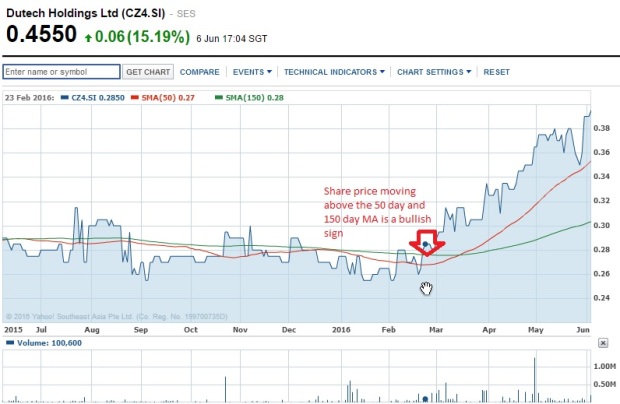
From here onwards, I’d likely utilise TA to determine whether to hold on, add further (highly unlikely), or to exit.
Addenum
As discussed in the comments, here is the chart showing the various margins of the 2 segments: