|
China Everbright Water has fallen 62% since hitting a high of $1.27 on 30 May 2014. What gives? (24 Mar 16)
|
Background of CEWL
CEWL share price has not performed well after touching an intraday high of $1.270 on 30 May 2014. At that time, CEWL was in the midst of completing the reverse takeover of China Everbright International’s water assets with the issuance of 1.94b shares at $0.703. Upon completion at end-2014, CEWL had a total daily designed capacity of over 3.4 million tons.
Subsequently, CEWL placed out 120.7m new ordinary shares to International Finance Corporation (“IFC”) and Dalvey Asset Holding Ltd (“Dalvey”) at an issue price of $0.940 in Jan 2015. As of end Dec 2015, CEWL has a total daily designed capacity of over 4.6m tons. Despite the developments, CEWL share price continued to slide to an intraday low of $0.410 on 21 Jan 2016 (all time low post share price consolidation since May 2014) before closing at $0.480 on 24 Mar 2016. This was even lower than its NAV per share of $0.495.
Industry prospects remain sanguine
According to the Water Pollution Prevention and Control Plan issued by the State Council of China, China targets at least 70% and 75% of the seven key regions’ water quality to achieve, or exceed the level of Category III by 2020 and 2030, respectively. Furthermore, according to DBS Research, there are more Public-Private Partnership (“PPP”) projects being released with a cumulative investment size of around RMB300b. CEWL is cognizant of the aforementioned vast industry prospects and plans to expand into integrated environmental water business, such as the construction of sponge cities and integrated watershed management etc.
Targets 1.0-1.5mt/d in FY16F; to reach 10mt/d by 2020
According to the latest analyst reports, CEWL targets an increase of 1.0-1.5mt/d in their total daily designed capacity in FY16F and is on track to reach 10mt/d by 2020.
| ♦ FY16 likely to be a better year |
|
"FY16 is likely to be better than FY15 as FY15’s earnings per share was pulled down by share issuance to IFC and Dalvey. |
Although it is premature to say whether CEWL can reach its objectives, it is assuring that firstly, CEWL managed to increase its capacity by 1.1mt/d in FY15. Secondly, its net gearing ratio is at a comfortable level of 41.8% where it has sufficient headroom to gear up for more acquisitions. It is noteworthy that its US$140m loan with IFC announced on 29 Jul 2015 has not been drawn down yet.
1st dividend in five years, coupled with share buybacks
CEWL has announced a final dividend of S$0.0035 / share, it first dividend payout in five years. Furthermore, CEWL has launched three rounds of share buybacks with a cumulative 7.8m share buyback bought at an average price of $0.493.
These actions likely underscore management’s confidence in CEWL’s business prospects going forward. (See Table 1 below)
Table 1: CEWL’s share buyback
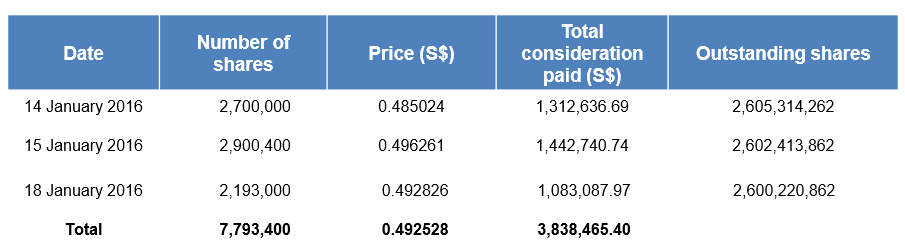
Source: Company
Valuations remain relatively attractive
Based on Table 2 below, CEWL trades at 13.9x FY16F PE and 1.0x FY15 P/BV vis-à-vis the average 15.5x FY16F PE and 1.9x P/BV.
If I exclude CT Env due to its extremely high P/BV, average FY16F and P/BV are 14.4x and 1.4x respectively, CEWL’s valuations seem to be relatively attractive, especially if we take into account its quasi state-ownership, good financials, ample debt headroom.
Table 2: CEWL’s metrics vs other water stocks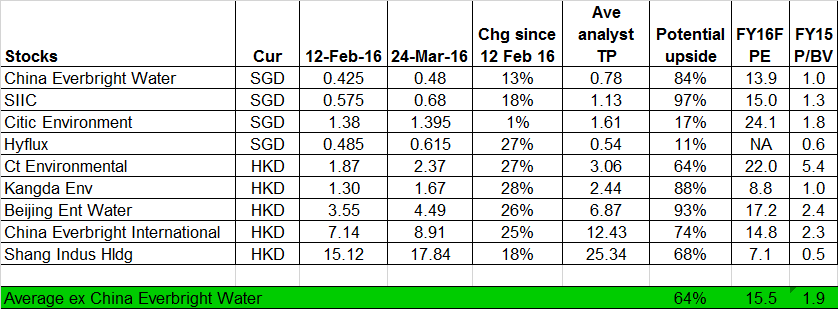
Source: Bloomberg & Ernest's compilations as of 24 Mar 2016
Chart analysis
Based on Chart 1 below, CEWL is entrenched in a medium to long term downtrend as evidenced by the declining exponential moving averages (“EMAs”) and the downward sloping trend line. Significant resistance is around $0.485 – 0.510. In the short term, there is a possibility of a potential bullish flag formation being formed. It will be positive if CEWL can break $0.485 – 0.510 with volume expansion and on a sustained basis. If CEWL can break $0.485 – 0.510 with volume expansion and on a sustained basis, it points to an eventual measured technical target of around $0.590. A break below $0.410 with volume expansion and on a sustained basis is negative for the chart.
Near term supports: $0.470 / 0.455 / 0.430
Near term resistances: $0.485 / 0.500 / 0.510
Chart 1: CEWL mired in a medium to long term downtrend
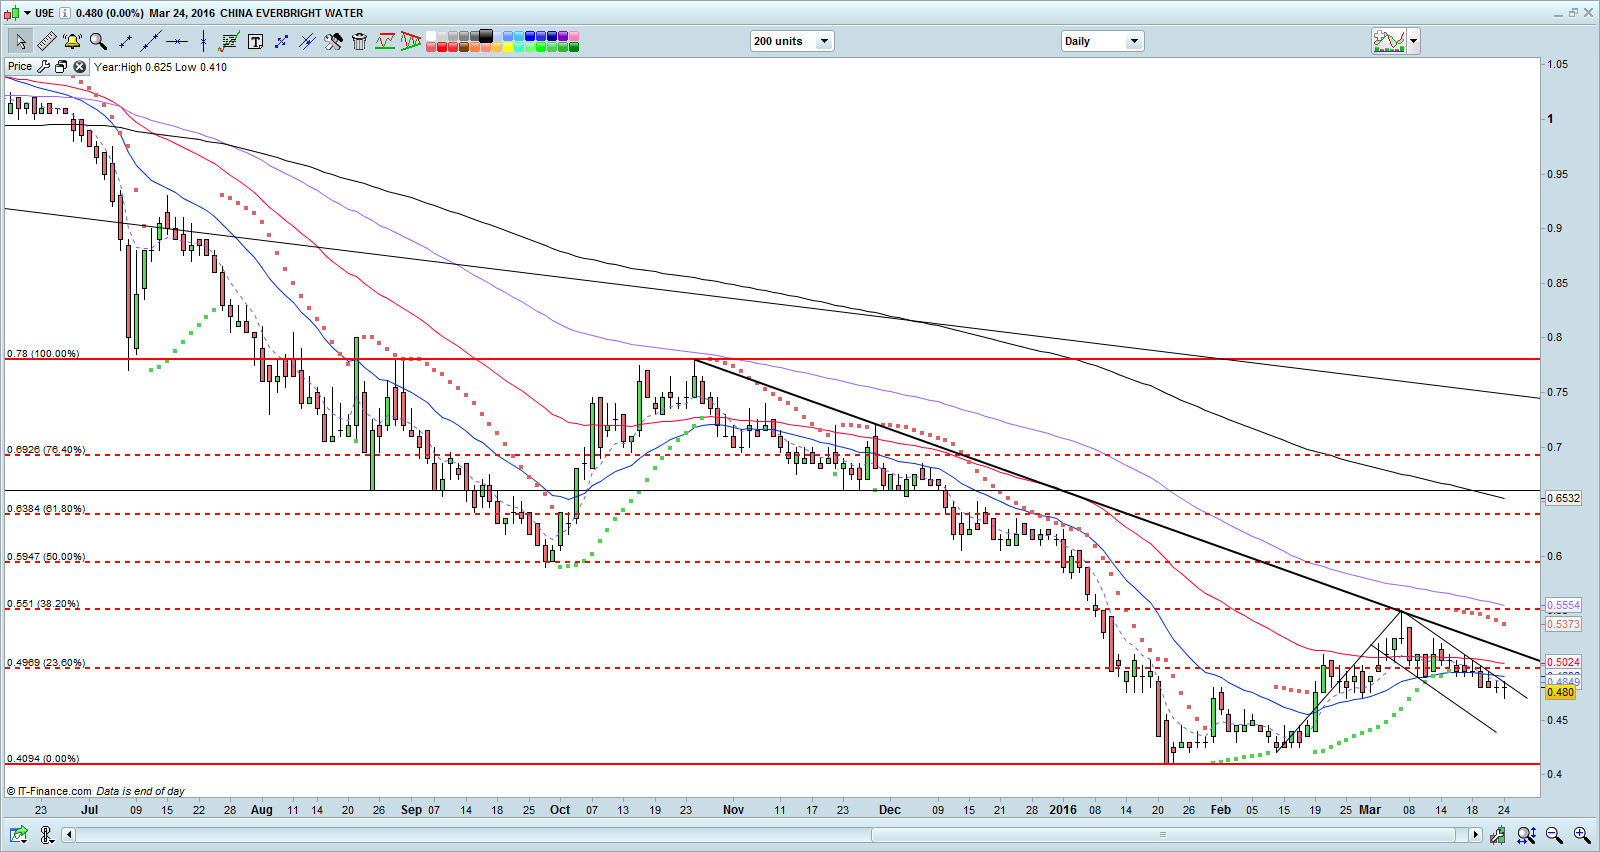 Source: CIMB complimentary chart as of 24 Mar 2016
Risks
Sharp share price decline may portend some negative developments
The sharp 62% share price decline from an intraday high of $1.270 since 30 May 2014 may portend some negative developments which is unknown to me, but (perhaps) known to the market. Readers should exercise their independent judgement and do their own research in this stock before arriving at any investment decision.
Lower than expected additions in CEWL’s total daily designed capacity
Lower than expected additions in CEWL will have an adverse impact in CEWL’s future earnings and their goal of reaching 10mt/d by 2020.
|
Conclusion In conclusion, CEWL seems interesting based on positive industry prospects; relatively attractive valuations; quasi state owned with strong financials and ample debt headroom and the possibility of expanding into integrated environmental water business, such as the construction of sponge cities and integrated watershed management etc. |

Disclaimer
Please refer to the disclaimer here