| Introduction The Straits Times Index (“STI”) has plunged more than 20% since hitting this year’s peak in April. Recently, the benchmark index has also broken its critical 3-year support level of 2,800 points. Global uncertainties have contributed to many analysts expecting further weakness in the STI and turnover volumes to taper off substantially in the near term. Is Singapore’s financial market really in the doldrums? According to Bloomberg data in the past 12 months, Singapore has generated 221 deals aggregating S$12 billion in value. Neighbouring countries with major stock exchanges like Malaysia and Indonesia generated lesser transactions and values in the same period. In comparison, Singapore has come out top in the region. |
Table 1: Total Number of Completed Deals and Value in the Region
1st October 2014 – 1st October 2015
| Rank | Country | # Deals | Value in S$ |
| 1 | Singapore | 221 | 12.0 B |
| 2 | Malaysia | 121 | 2.4 B |
| 3 | Thailand | 45 | 1.7 B |
| 4 | Indonesia | 60 | 854.7 M |
| 5 | Vietnam | 41 | 534.9 M |
M&A Activities in Singapore Many corporate advisors are citing increasing merger and acquisition (“M&A”) activities in privatisations and reverse take-overs (“RTO”) due to better valuation and more realistic expectations. During the past 12 months, the total size of company takeovers stands at a staggering S$3.9 billion while a single privatisation deal accounted for S$186 million in the same period. Completed cross border deals champions the cause generating around S$5.4 billion through 121 transactions in the last 12 months. The cross border numbers fortifies the fact that Singapore remains a prime financial destination in the region.
 Robson Lee, Partner, Gibson Dunn & Crutcher LLP, a global law firm headquartered in the USA. NextInsight file photo.“M&A activities in Singapore are still very vibrant! Despite equity markets in the region going through a correction phase, there are always opportunities for listed companies to consider through M&A, industry consolidation and corporate restructuring etc. For example, listed companies can even consider delisting and to restructure without the burdens of a listed company. After which, the said company can relist later to take advantage when equity markets recover,” proposed Robson Lee, Partner of Gibson Dunn & Crutcher.
Table 2: Total Number of Completed Deals and Value in Singapore
1st October 2014 – 1st October 2015
| Type of Deal | # Deals | Value in S$ |
| Cross Border | 121 | 5.4B |
| Additional Stake Purchase | 41 | 5.4B |
| Company Takeover | 73 | 3.9B |
| Tender Offer | 4 | 3.6B |
| Asset Sale | 27 | 2.7B |
| Minority Purchase | 90 | 1.9B |
| Private Equity | 58 | 1.69B |
| Venture Capital | 50 | 1.1B |
| Joint Venture | 10 | 393.5M |
| Majority Purchase | 19 | 327.2M |
| Mandatory Offer | 1 | 321.4M |
| Squeeze Out | 1 | 321.4M |
| Going Private | 1 | 186.0M |
| Private Placement | 10 | 160.9M |
| Spin-off | 1 | 148.2M |
| Financing Round | 14 | 136.9M |
| Sale Leaseback | 1 | 98.1M |
| Option Agreement | 5 | 53.8M |
| PE Seller | 1 | 24.9M |
| Seed | 9 | 7.3M |
| Debt for Equity | 1 | 5.6M |
| Angel | 1 | 4.2M |
| Related Party Transaction | 1 | 947.7k |
 Kathy Zhang, Group MD, Financial PR.
NextInsight file photo.Listed companies have also not rested their laurels judging by their heightened activities in investor relations (“IR”) efforts and spending.
“According to our IR survey, majority of companies that participated reported an annual IR budget of S$50,000 to S$100,000. Transactional IR is growing in importance over time. Our firm has assisted many projects in tandem with corporate advisors covering M&A, privatization and cross border transaction etc.,” commented Ms Kathy Zhang, Group Managing Director of Financial PR Pte Ltd (“FPR”).
The scope of an IR firm these days has grown beyond bridging the gap between listed companies and their shareholders. Today, the IR function has evolved from managing relationships with analysts to advising listed companies in their fund raising communication.
Understanding the nature of the deal in terms of the business, the legal risk and the financial impact is paramount in communicating the right message to the market, media and investors. To cite an example, many times we have seen misguided investors questioning a company’s recent acquisition via issuing new shares resulting in an earnings dilution. Therefore communicating the company’s rationale is key to a successful share placement exercise.  Henn Tan, CEO of Trek 2000.
NextInsight file photo.“It is important to engage the investment and media community proactively. With a strong belief in transparency and disclosure, we work with our investor relations team to communicate consistent key messages and positioning to the investment market. As a listed company, we strive to enhance shareholder value through capitalising the equity market. To that end, we recently completed a placement exercise where we forged a new partnership and raised S$11.6 million to grow our war chest to accelerate growth,” echoed Henn Tan, Chairman and CEO of Trek 2000 International Ltd.
A survey was conducted by FPR, a 5 times winner of Singapore Prestige Brand Award, among listed companies on SGX to gain more valuable insights.
Research Methodology
Responses were collected from a group of 76 SGX-listed companies during the first half of 2015. The participants ranged from Large Caps (market capitalization of more than S$1 billion), Mid Caps (market capitalization of S$300 million to S$1 billion) to Small Caps (market capitalization of S$300 million and below). The sample size closely mimics the total population of listed companies based on the percentage of representative market capitalization.
Table 3: Sample Size
| Market Capitalization | No. of Companies |
% of Total
|
| Big-Caps (> S$1b) | 12 | 15.8% |
| Mid-Caps (S$300m - S$ 1b) | 10 | 13.2% |
| Small-Caps (< S$300m) | 54 | 71.0% |
| Total | 76 |
Table 4: Population Representation
| Market Capitalization | % of Total |
| Big-Caps (> S$1b) | 15% |
| Mid-Caps (S$300m - S$ 1b) | 17% |
| Small-Caps (< S$300m) | 68% |
The 3 key survey findings uncovered are: 1) Analysts Unlock Higher Valuation and Liquidity for Companies; 2) Attracting Institutional Investors seen as No. 1 Importance for IR activities; 3) Small Caps Spend More than Mid Caps in terms of their IR Budget.
1) Analysts Unlock Higher Valuation and Liquidity for Companies
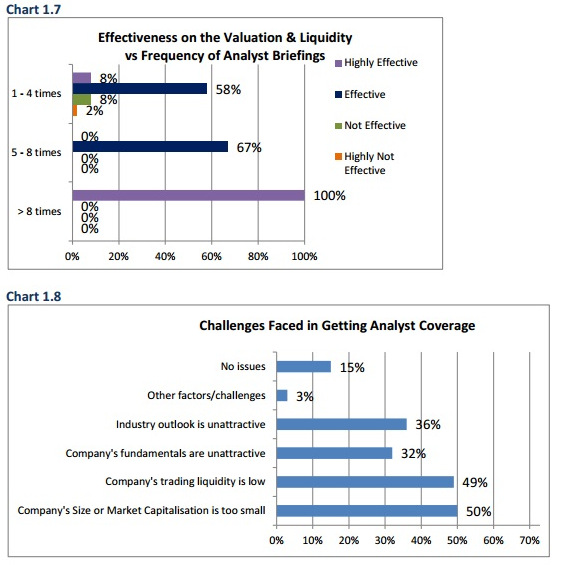
Companies are surveyed based on which IR activity they perceive derive the most effect on their valuation and liquidity. Overall, 57% of the respondents believed that analyst briefings are instrumental in helping them to create interest in the market and thereby improving their share price valuation and liquidity. The more frequent the companies organize such briefings with analysts; the more effective the result it has on their valuation and liquidity according to the chart 1.7. Therefore, we can conclude that conducting analyst briefings represent the most effective IR communication tool as per our survey.  Andrew Chow, head of research, UOB Kay Hian“Through primary research, we undertake a vigorous process to discover undervalued stocks by valuation screens, company meetings, site visits and industry analysis. However, there are still certain inefficiencies in the form of information gap between listed companies and their investors. Listed companies who are more proactive and forthcoming in their IR approach would allow analysts to better understand and appreciate their business strategies, directions and decisions and that in turn would help analysts in performing their role. This is extremely critical in the formation of the share price discovery process,” commented Mr Andrew Chow, Head of Research of UOB Kay Hian.
A significant 100% of Big Caps conduct analyst briefings regularly. Thus, Big Caps are very well covered by both local and overseas based investment analysts. Currently, 82% of the Mid Caps conduct analyst briefings while 18% chose to conduct none at all. Notably, 65% of the Small Caps organize analyst briefings from time to time while the remaining 35% do not. Perhaps, this helps to explain their focus in gaining more media coverage and subsequently analyst coverage in the long run. At the same time, majority of the Small Caps faces certain challenges in gaining analyst coverage. About 50% of the participants think that the main reason is either capitalisation or trading liquidity are too low to appear under the radar of the analysts. This brings us back to the question why Small Caps are much more willing to spend and gain coverage.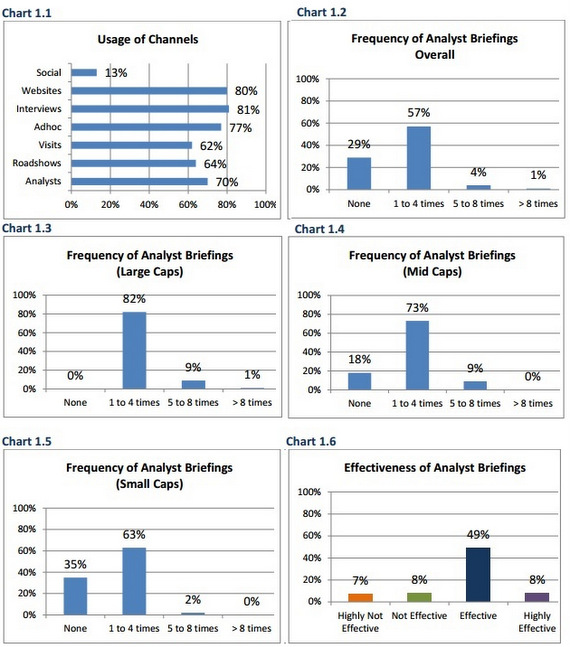
2) Attracting Institutional Investors
Seen as No.1 importance for IR Activities The key objectives of listed companies vary across Big Caps to Small Caps. 50% of the respondents believed that attracting institutional investors are important in their overall IR strategy. Contrary to popular beliefs, only 36% of the listed companies surveyed rank ‘attracting retail investors’ as an important objective.
Big Caps are more active in conducting ad hoc investor meetings and teleconferences more than 8 times annually. Big Caps have a large following of index-linked funds, unit trusts, exchange traded funds (“ETFs”) hedge funds and other institutional funds etc. Most major funds have a self-enforced market capitalization mandate to invest in SGX listed companies. Therefore, it is imperative for companies seeking institutional investors to maintain a certain market capitalization size and trading liquidity level. On top of that, 73% of the Big Caps have hosted a minimum of 1 to 4 company site visits for the analysts and funds. CFO Liu Hua. NextInsight file photo.“Yangzijiang has always kept high focus on timely dissemination of information and has maintained high standards of transparency, disclosure, IR and communications. We work with FPR to regularly host analyst briefings and also engage institutional investors so that the market is regularly updated on the company’s progress. We feel that meeting analysts and investors and addressing all their concerns regularly is highly essential as we want the correct message and the relevant facts to be known to the market in a timely manner. Our Chairman and CEO make the effort to fly to Singapore at least once a quarter and attend the company’s quarterly results briefings, road shows, media interviews and investor meetings. We intend to keep this tradition on-going and hope that the market will continue to appreciate our IR efforts,” commented Ms Liu Hua, Chief Financial Officer of Yangzijiang.
Furthermore, 42% of the participants yearn for more media coverage. Amongst the respondents, 76% of the Small Caps conduct at least 1 to 4 media interviews per year to drum up interest in their respective companies. Getting more publicity in mainstream media from time to time can be instrumental in promoting the company to analysts and investors who have not heard about the company.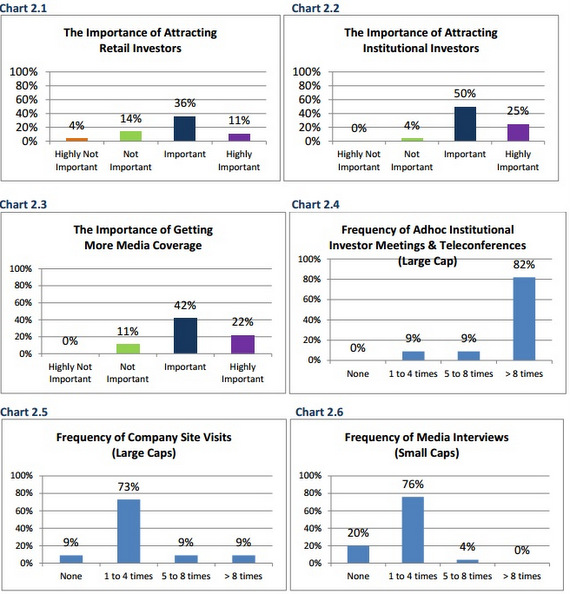
3) Small Caps Spend More than Mid Caps
By comparing the annual budgets on IR, Small Caps tend to spend more than the Mid Caps. Interestingly, 64% of Mid Caps spend less than S$50,000 per annum while 59% of Small Caps spend more than S$50,000 per annum in their quest. This is primarily due to Small Caps placing a high emphasis on gaining media coverage to improve their companies’ market capitalization and trading liquidity. Some Small Caps would also like to create more awareness for their company’s brand and image through more publicity. Small Caps generally has a desire to gain more recognition as compared to their larger peers. On the other hand, Big Caps naturally has bigger budgets and spend the most among listed companies for their IR activities. 54% of Big Caps spend more than S$100,000 per year in conducting IR activities! In contrast, Mid Caps remained lukewarm in their approach towards effective communication to the investing community.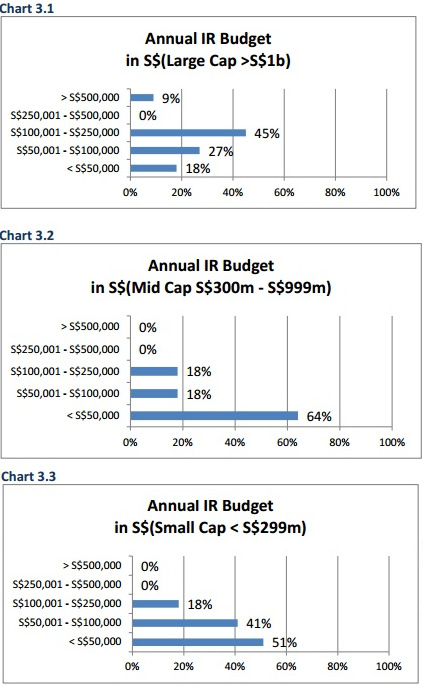
Moving Ahead
Other than M&A activities, other financing activities have also started to gain some traction going well into next year based on a healthy pipeline of IPOs, additional share placements and rights issue exercises. From the period 1 st October 2014 to 1st October 2015, the Singapore Stock Exchange’s (“SGX”) Main board and Catalist board have both managed to list 17 IPOs raising total proceeds of approximately S$762.6 million. However, many newly listed companies prefer to list on the Catalist board. Surprisingly, additional share placements have accounted for S$1.0 billion while rights issues have raised a total of 2.8 billion in the past 12 months. Contrary to popular beliefs, Singapore market is truly buoyant and forging forward.
“We continue to have a healthy pipeline of companies seeking to list on SGX, with the majority of our new mandates coming from overseas companies. Catalist-listed companies tend to benefit from more participation from institutions and high net worth individuals, improved liquidity with higher turnover velocity, wider access to capital via placements, rights issues and medium term note (MTN) programs. Given the challenging and volatile market conditions, it is critical that listing aspirants work closely with their sponsors and investor relations firms to clearly communicate their business model and future plans to shareholders and external stakeholders,” commented Mark Liew, Managing Director of Prime Partners Corporate Finance.
Table 5: Total Number of IPOs and Offer Size in Singapore
1st October 2014 – 1st October 2015
| Date | Issuer Name | Offer Size in S$M |
| 10/14/2014 | ISEC Healthcare Ltd | 19.6 |
| 10/15/2014 | Serrano Ltd/Singapore | 6.9 |
| 10/30/2014 | Zico Holdings Inc | 14.4 |
| 10/30/2014 | MS Holdings Ltd | 6.8 |
| 11/21/2014 | iFAST Corp Ltd | 49.2 |
| 11/26/2014 | Keppel DC REIT | 512.9 |
| 11/28/2014 | UG Healthcare Corp Ltd | 6.2 |
| 12/01/2014 | Huationg Global Ltd | 5.5 |
| 12/02/2014 | mm2 Asia Ltd | 9.4 |
| 04/01/2015 | LHN Ltd | 17.0 |
| 05/12/2015 | Singapore O&G Ltd | 10.9 |
| 06/25/2015 | iX Biopharma Ltd | 30.1 |
| 06/29/2015 | Choo Chiang Holdings Ltd | 11.6 |
| 06/29/2015 | NauticAWT Ltd | 5.6 |
| 07/31/2015 | CMC Infocomm Ltd | 6.0 |
| 08/11/2015 | Soo Kee Group Ltd | 33.8 |
| 09/08/2015 | TLV Holdings Ltd | 16.8 |
Source: Bloomberg
Table 6: Total Number of Additional Share Placement and Offer Size in Singapore
1st October 2014 – 1st October 2015
| Date | Issuer Name | Offer Size in S$M |
| 10/02/2014 | Libra Group Ltd | 3.0 |
| 10/10/2014 | Smartflex Holdings Ltd | 3.6 |
| 11/11/2014 | Resources Prima Group Ltd | 16.6 |
| 12/04/2014 | SIIC Environment Holdings Ltd | 98.3 |
| 12/08/2014 | Lippo Malls Indonesia Retail T | 40.0 |
| 03/02/2015 | BlackGold Natural Resources Lt | 25.4 |
| 04/22/2015 | Soilbuild Business Space REIT | 90.0 |
| 05/03/2015 | Ramba Energy Ltd | 18.4 |
| 05/07/2015 | Ramba Energy Ltd | 2.9 |
| 05/20/2015 | Keppel Infrastructure Trust | 412.3 |
| 06/04/2015 | Viva Industrial Trust | 63.1 |
| 06/24/2015 | Trek 2000 International Ltd | 11.8 |
| 06/25/2015 | Frasers Hospitality Trust | 74.3 |
| 07/23/2015 | Frasers Commercial Trust | 142.1 |
Source: Bloomberg
Table 7: Total Number of Rights Issue and Offer Size in Singapore
1st October 2014 – 1st October 2015
| Announced Date | Issuer Name | Offer Size in S$M |
| 10/17/2014 | Tiger Airways Holdings Ltd | 234.0 |
| 11/04/2014 | Singapore Medical Group Ltd | 3.8 |
| 12/30/2014 | Swiber Holdings Ltd | 45.9 |
| 12/30/2014 | Lorenzo International Ltd | 9.1 |
| 01/09/2015 | Lasseters International Holding | 15.0 |
| 01/20/2015 | Elektromotive Group Ltd | 7.3 |
| 01/26/2015 | WE Holdings Ltd | 4.2 |
| 02/27/2015 | GKE Corp Ltd | 12.8 |
| 05/20/2015 | Keppel Infrastructure Trust | 112.7 |
| 05/26/2015 | Equation Summit Ltd | 5.0 |
| 05/30/2015 | Ezra Holdings Ltd | 202.2 |
| 06/15/2015 | KrisEnergy Ltd | 169.5 |
| 06/18/2015 | Jardine Cycle & Carriage Ltd | 1027.6 |
| 06/29/2015 | OUE Commercial Real Estate Inv | 218.3 |
| 06/29/2015 | Serrano Ltd/Singapore | 10.5 |
| 07/02/2015 | IREIT Global | 88.7 |
| 07/10/2015 | Metech International Ltd | 4.2 |
| 07/31/2015 | China Merchants Holdings Pacific | 633.8 |
| 08/20/2015 | Cityneon Holdings Ltd | 15.9 |
Source: Bloomberg