The following content was recently published on Drizzt's blog, www.investmentmoats.com, and is reproduced with permission.

WE RECENTLY did an analysis to see how dividends, splits, rights and bonus shares affected the returns of certain stocks.
By popular demand, after writing out my take on the performance of Noble Group, I have decided to do one on of Singapore's biggest conglomerates - Keppel Corp.
You can view all the factsheets on my Google Spreadsheet here [SGX Singapore Stocks Factsheet >>]
Keppel Corp has been a favorite stock of a lot of rich people or people aspiring to be rich. It is one of the prominent stocks in the portfolio of investors who do not look, or have no time to look, at the stock market everyday.
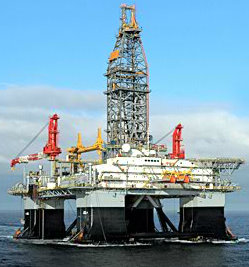
Business-wise, it is pretty diversified across ship building, repair and rig building, properties and oil and gas infrastructure. All of these industries have been driving the Singapore economy and have enjoyed thriving demand for the past 10 years.
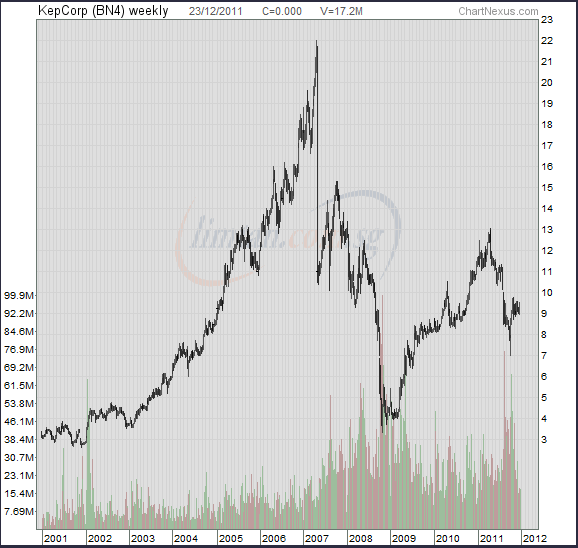
It is no surprise that the price movement of this blue chip stock mirrors the general movement of the STI.
Astute investors have been handsomely rewarded if they picked this stock up during the recession in 2001-2003 or 2009.
The most significant drop in 2007 was the result of a 2-for-1 stock split and factoring that, the low of 2009 should have been $8 instead of $4.
Had you held Keppel since 2001 you would have done pretty well after going through 2 bull runs and a bear run.
Purchasing at a low of $3.26 at the start of 2001 would have yielded you an unrealized gain of 534.36% and total dividends of 202.73%. The annualized unrealized gain is 18% and the dividend yield is 10%.
The result is not as spectacular as Noble’s 11 year price movement, but nevertheless it had a good yield and capital growth.
One thing you would notice is that the distribution from Keppel can be very uneven. As a lot of its rig building and property-related business is very lumpy in profits, the dividend distribution ends up being lumpy too.
This is why a lot of dividend-hungry folks like me don’t go for stocks like this. However, as stated in the Noble article, what matters is the earnings growth and Keppel was powered by 2 very strong trends taking place from 2001-2011: Property and Oil & Gas.
The return turned out to be much better than that of any REIT or dividend stock that pays predictable returns.
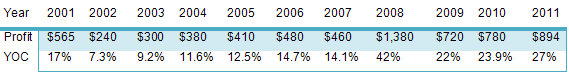
If we tabulate the annual returns, there are only 2 lumpy periods (2001 and 2008). Other than that, Keppel has been steadily raising its dividends every year. Your yield on cost has been climbing at a rate of roughly 6% per year.
What if you overbought it?
Now everyone would say that this is only a good investment if you bought it in a deep recession. I think everyone would be afraid to hold a stock if he did not buy at the “right” price.
Ultimately what made Keppel a good investment was this:
- Management rode the trend on 2 major trends
- The profits, despite the stock market upheavals, continued to grow
- The management is shareholder-friendly in that they return increasing payouts at a sensible level to investors
Price is what you pay and value is what you get. If you had paid the equivalent of $18 (there was a split in 2007) which is about today's price of $9, your return in 11 years would still be 51%. The majority of the return (36%) came from dividends.
Make a copy of my spreadsheet and try this: change the original purchase price and see how much you would have to overpay in order for you to lose money in 11 years.
I did that, and turns out you need to buy Keppel Corp at $27 in order for you to start losing money.
By day, Drizzt is a software and system support specialist. By night, he shares on his blog his escapades in money management, investing and his love for all things technology. Drizzt holds a degree in Computer Science from the National University of Singapore and is certified at many levels in systems and software competency.