The sales comprised sales to its distributors in various parts of the world and its direct coronary sales in the United States.
QT Vascular sold 30,344 units of its products in FY2014, almost triple the volume sold in 2013.
For 2014, 89.2% of sales came from the US, 8.8% from Asia Pacific and 2.0% from Europe.
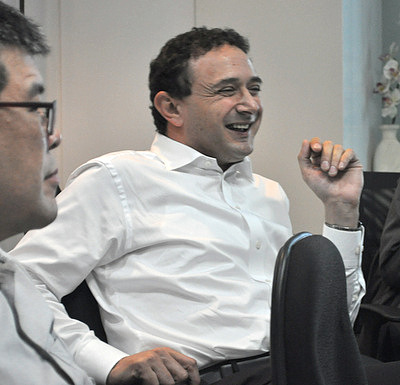 Dr. Eitan Konstantino, CEO of QT Vascular: “We are pleased with the group's performance for the year, particularly our sales volume. The group is on track for growth and we expect sales to continue to grow in 2015, underpinned by a favourable macro environment, our strong line-up of products, and our efforts to widen our distribution network globally.”
 NextInsight file photo.Stronger sales were recorded in the US and Asia Pacific, with growth of 156.7% and 110.7% respectively.
With the improved sales, the Group achieved a gross profit of US$3.3 million with gross margin of 25.4% in FY2014, a reversal from the gross loss of US$0.4 million in FY2013.
Operating expenses were higher, led by R&D expenses, which grew by 197.6% to US$6.7 million.
As QT Vascular continued to innovate, it incurred US$9.7 million of research and development expenses. This was partially offset by the capitalization of US$3.0 million of development expenses during FY2014.
Administrative expenses increased 78.5% to US$13.7 million in FY2014 along with the general increase in business activities.
The increase in administrative expenses was also due to professional service fees for its IPO of US$1.6 million, which is non-recurring, and an ongoing litigation that it is involved in.
The Group’s net loss attributable to shareholders in FY2014 was slightly lower at US$34.2 million, compared with a net loss attributable to shareholders of US$34.5 million in FY2013.
Excluding one-off items, the Group’s 2014 net loss attributable to shareholders would have improved to US$28.1 million.
The Group had a healthy financial position, with net assets of US$31.7 million and a net cash balance of US$20.2 million as at 31 December 2014. This was mainly due to the cash proceeds from its IPO in April 2014.
Recent story: QT VASCULAR: Overlooked healthcare play?


